Category Archives: facts & data points

Healthcare Fraud – the $272 billion swindle

Health-care fraud

The $272 billion swindle

Why thieves love America’s health-care system
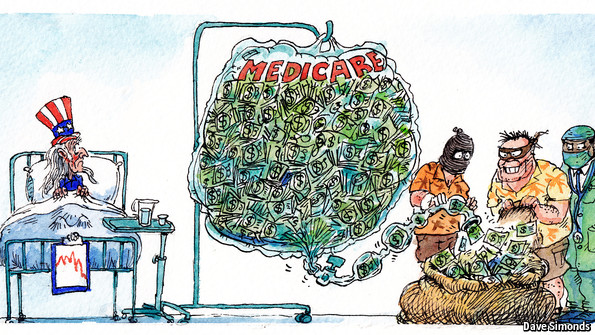
INVESTIGATORS in New York were looking for health-care fraud hot-spots. Agents suggested Oceana, a cluster of luxury condos in Brighton Beach. The 865-unit complex had a garage full of Porsches and Aston Martins—and 500 residents claiming Medicaid, which is meant for the poor and disabled. Though many claims had been filed legitimately, some looked iffy. Last August six residents were charged. Within weeks another 150 had stopped claiming assistance, says Robert Byrnes, one of the investigators.

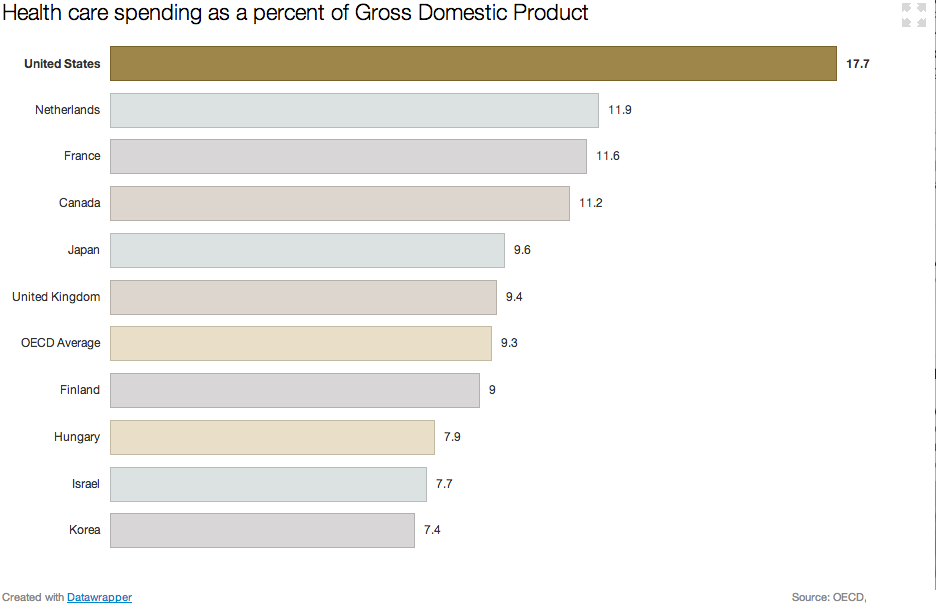
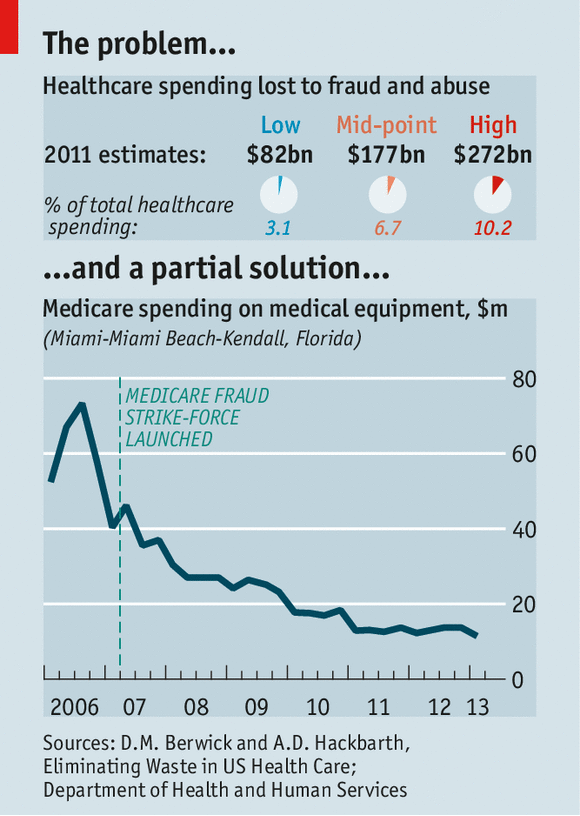
Health care is a tempting target for thieves. Medicaid doles out $415 billion a year; Medicare (a federal scheme for the elderly), nearly $600 billion. Total health spending in America is a massive $2.7 trillion, or 17% of GDP. No one knows for sure how much of that is embezzled, but in 2012 Donald Berwick, a former head of the Centres for Medicare and Medicaid Services (CMS), and Andrew Hackbarth of the RAND Corporation, estimated that fraud (and the extra rules and inspections required to fight it) added as much as $98 billion, or roughly 10%, to annual Medicare and Medicaid spending—and up to $272 billion across the entire health system.

Federal prosecutors had over 2,000 health-fraud probes open at the end of 2013. A Medicare “strike force”, which was formed in 2007, boasts of seven nationwide “takedowns”. In the latest, on May 13th, 90 people, including 16 doctors, were rounded up in six cities—more than half of them in Miami, the capital city of medical fraud. One doctor is alleged to have fraudulently charged for $24m of kit, including 1,000 power wheelchairs.

Punishments have grown tougher: last year the owner of a mental-health clinic got 30 years for false billing. Efforts to claw back stolen cash are highly cost-effective: in 2011-13 the government’s main fraud-control programme, run jointly by the Department of Health and Human Services (HHS) and the Department of Justice, recovered $8 for every $1 it spent.

As fraud-fighting has intensified, dodgy billing has tumbled in areas that were most prone to abuse, such as durable medical kit and home visits (see chart). Home-health fraud—such as charging for non-existent visits to give insulin injections—got so bad that the CMS, which runs the programmes, called a moratorium on enrolling new providers in several large cities last year. Since tighter screening was introduced under Obamacare, the CMS has stripped 17,000 providers of their licence to bill Medicare. Thousands of suppliers also quit after being required to seek accreditation and to post surety bonds of $50,000.
Yet the sheer volume of transactions makes it easier for miscreants to hide: every day, for instance, Medicare’s contractors process 4.5m claims. In this context the $4.3 billion recovered by fraud-busters in 2013, though a record, looks paltry.

Better than cocaine

Fraud migrates. Take one popular scam: overbilling for HIV infusion, an outdated therapy that Medicare still covers despite the existence of cheaper, better alternatives. This scam waned in Florida after a crackdown, only to pop up in Detroit, run by relatives of the original perpetrators.

Fraud mutates, too. As old hustles are rumbled, fraudsters invent new ones. “We’ve taken out much of the low-hanging fruit,” says Gary Cantrell, an investigator at HHS—an example being the thousands of bogus equipment suppliers registered to empty shopfronts. Scams now need to be more sophisticated to succeed, he argues. Doctors, pharmacies, and patients act in league. Scammers over-bill for real services rather than charging for non-existent ones. That makes them harder to spot.

Some criminals are switching from cocaine trafficking to prescription-drug fraud because the risk-adjusted rewards are higher: the money is still good, the work safer and the penalties lighter. Medicare gumshoes in Florida regularly find stockpiles of weapons when making arrests. The gangs are often bound by ethnic ties: Russians in New York, Cubans in Miami, Nigerians in Houston and so on.

Stealing patients’ identities is lucrative. Medical records are worth more to crooks than credit-card numbers. They contain more information, and can be used to obtain prescriptions for controlled drugs. Usually, it takes victims longer to notice that their details have been pinched. The Government Accountability Office has recommended that the CMS remove Social Security numbers from Medicare cards to prevent fraud. It has yet to do so.

In one fast-growing area of fraud, involving pharmacies and prescription drugs, federal investigators have seen caseloads quadruple over the past five years. Elderly patients may receive kickbacks to sell their details to a pharmacist. He will then provide them with drugs they need while billing Medicare for costlier ones.

Paid recruiters scour nursing homes for accomplices. Some pharmacies also pay wholesalers to produce phoney invoices. Others bribe medical workers for leftover pills: in April a pharmacy-owner in Louisiana admitted to paying nursing-home staff a few hundred dollars a time to bring her unused drugs, which she repackaged and sold as new, billing Medicare $2.2m for the recycled meds between 2008 and 2013.

Another scam is to turn a doctor’s clinic into a prescription-writing factory for painkillers (or “pill mill”) and resell them on the street. A clinic in New York was recently charged with fraudulently producing prescriptions for more than 5m oxycodone tablets, which were sold locally for $30-$90 each. The alleged conspirators included doctors and traffickers who ran crews of “patients” so large that long queues sometimes formed outside the clinic. The doctors charged $300 per large prescription. One raked in $12m. To cover their backs they would ask for scans or urine samples purporting to show injuries. The fake patients typically obtained these from the traffickers at the clinic door.

False billing by pharmacies is rife. New York’s Medicaid sleuths have stepped up spot checks to see if the drugs in the back room square with invoices. But this is a lot of work, so most outlets are never checked.

Dozens of operators of ambulances and ambulettes (vans designed to take wheelchairs) have been caught offering kickbacks to patients to pretend they can’t walk. This lets them qualify for “emergency” pick-ups, for which the company can charge $400 per patient. New York has clamped down with roadside checks. But in one case, word that a checkpoint had been set up spread so quickly—as drivers called each other and a local Russian-language radio station put out a warning—that the number of ambulettes on the main street “went from several to none in a few minutes as they re-routed down side streets”, says Chris Bedell, who took part.

This sort of pavement-pounding investigative work remains important. Another approach is the “desk audit”, where possible overpayment is identified but the only way to ascertain losses is to sift through heaps of records manually. Florida’s Agency for Health Care Administration (AHCA) has recovered up to $50m a year solely from hospitals billing for treatment of illegal aliens that is wrongly coded as “emergency care”. But the work is labour-intensive. Data-crunching technologies are increasingly being used to complement the human eye. “When I started in 1996 we had little access to data,” says HHS’s Mr Cantrell. “It had to be requested ad hoc from CMS contractors.” Now a central database houses near-real-time information for Medicare. This helps the 300 workers at the inspector-general’s office who are trained in data analytics to “triage” the tips that flow in. “We receive far more than we can investigate closely,” says Mr Cantrell.

The CMS is still getting to grips with a new predictive-analysis system, which was introduced in 2011 to catch Medicare fraud earlier and is modelled on tools used by credit-card firms. This identified $115m of dodgy payments in 2012, its first full year. (The number for the second year has yet to be released.) Another useful tool is voice-recognition technology. In Florida, health workers who conduct home visits have to call in from the patient’s phone during each appointment to have their voice pattern matched against the one stored electronically. This has greatly reduced billing for non-visits.

Technology is no panacea, however. Medicare’s computers were pumping out thousands of payments a year for patients who had been struck off the programme before receiving their treatment, until human hands began to intervene this year. The electronification of patient records can allow “cloning”, in which treatments automatically trigger excessive billing codes by defaulting to set templates.

This is the medical world’s “dirty secret”, says John Holcomb of the Texas Medical Association. Everyone talks about it in the doctor’s lounge, but few complain. (What doctors do complain about is the complexity of the bill-coding system: see article.) Moreover, there are gaps in the data picture—some of which could grow. Federal investigators complain that there is no proper national repository for Medicaid information, which is held state-by-state.

A bigger worry is that, as ever more Medicare and Medicaid beneficiaries move to “managed  care” (privately administered) plans, government sleuths will have access to less data. This could lead to lower fraud-related recoveries.

Efforts have been made to improve information-sharing between government and private insurers, including the creation of a public-private forum, the National Health Care Anti-Fraud Association (NHCAA). But some insurers are reluctant to take part, fearing that being too open with their data would invite lawsuits over privacy. Fraudsters bank on public and private payers not working together to connect the dots, said Louis Saccoccio, the head of the NHCAA, at a recent hearing.

The NCHAA is pushing for federal immunity guarantees for insurers that share fraud-related information. On May 20th a bipartisan group of senators introduced a bill to make it easier for insurers to share data with Medicare. It would also require Medicare to check new providers for links to firms that have previously swindled the taxpayer (which you might have thought it was already doing).

Obamacare has had a big impact, says Shantanu Agrawal of the CMS. One thing it requires is that when a state kicks out a dodgy Medicaid provider, it shares that information with Medicare, and vice versa. Previously there were legal impediments to doing this, for some reason.

Resources are tight for investigators. New York has a Medicaid investigations division of 110 souls (including support staff) to scrutinise $55 billion of annual payments and 137,000 providers. Gloria Jarmon, an auditor with the HHS, told a recent hearing that budget cuts will probably force it to cut its oversight of Medicare and Medicaid by 20% in this fiscal year. “Everyone [in Congress] is excited that we bring in eight times more than we cost, but that hasn’t translated into more funding,” laments Mr Cantrell.

This squeeze makes it all the more important to enlist help. More than 5,000 old folk have joined “Medicare patrols”, which hold local meetings to raise awareness of common scams. A crucial part of the anti-fraud effort is the new, simpler Explanation of Benefits (summary statement) that lets recipients see who has billed the programme with their identification numbers. This is “a landmark change”, a CMS executive told Congress last year, adding: “Our best weapon in fighting fraud is our 50m Medicare beneficiaries.”

http://www.economist.com/news/united-states/21603078-why-thieves-love-americas-health-care-system-272-billion-swindle

Living to 150…

Most of the recent change in life expectancy has been that sick men are having their life with sickness prolonged.

https://www.mja.com.au/insight/2015/6/will-cairns-living-150

Will Cairns: Living to 150

Will Cairns
Monday, 23 February, 2015

HUMAN life expectancy will increase to 150 years within this century. Really?

When I was a GP I used to visit my frail elderly nursing home patients in my lunch break. Frequently I found them fast asleep in front of Days of Our Lives. This gave me pause for thought about how we live out our final years.

In the past few weeks it has been interesting to see a number of commentators suggesting that before the end of this century the advance of technology will enable some people to live on to the age of 150.

Among the evidence cited for this is the observation that the average life expectancy has increased from about 40 years to 80 years in the past 150 or so years and that this trend will continue.

The facts tell us otherwise. This Kaplan–Meier graph drawn up from several different life tables shows the proportion of the population who have remained alive over the 100+ years from their birth.

Over the past 200 years or so the application of scientific discovery — public health measures, improved nutrition and, lately, disease treatment — have almost stopped us from dying as children and prolonged our lives as mature adults.

However, our numbers plummet as we approach 100 years of age because all of these interventions make no difference to the reality that we eventually wear out and die. Apart from the odd unverified outlier, only one person has ever been confirmed as living for more than 120 years.

Life tables for the US dating back to the 19th century show the limits of modern technology to deal with the failings of old age:

US white males 1850 2005
Life expectancy at birth 38.3 77.4
Life expectancy at age 50 71.6 80.7

So, in the past 150 years, in the most powerful nation in the world with the best that modern technology and affluence can throw at the challenge, while the average life expectancy at birth has risen by 39.1 years, the life expectancy of a 50-year-old has increased by only 9.1 years.

It used to be that the highest mortality was among children; now it is among the elderly. A man aged 65 years living in the UK in 2004‒2006 could expect to survive for another 16.9 years, of which 10.1 years (59.8%) were deemed to be healthy.

Life expectancy of 65-year-old males in UK
2004-2006 2007-2009
Total 16.9 years 17.6 years
Disability free 10.1 years 10.2 years

While the life expectancy of a 65-year-old man increased by 0.7 years between 2004‒2006 and 2007‒2009, the healthy life expectancy has increased by 0.1 years. Most of the recent change in life expectancy has been that sick men are having their life with sickness prolonged.

There have always been at least a few people who avoided fatal infections, childbirth, accidents, wars, worn-down teeth, cancer, heart disease, or even just wearing out earlier, and have lived to be more than 100 before they slow down and die.

More of us become centenarians now because we don’t die of other things earlier, but there has been no significant increase in the maximum time that people can remain alive.

For most of us our maximum life expectancy remains less than 100 years, and for some far less. There is no evidence that modern technology has been able to stop even people who get no particular disease from just grinding to a halt when their time is up.

We have not been able to put more sand into our hourglass to increase the number of the days of our lives.

Talk of living to 150 is a distraction. The real challenge for the community as a whole is to accept the inevitability of death and to reintegrate that acceptance into culture.

As health workers and health care managers, we can all play a vital role in that process, both in how we communicate our understanding of death as a normal part of life and in how we incorporate it into the care of our individual patients.
Associate Professor Will Cairns is Director of Palliative Care in Townsville and author of the eBookDeath rules — how death shapes life on earth, and what it means for us.

* Australia 2008-2010 – Males
USA 2006
England/Wales 1838-1854 – Males
South Australia 1891-1900 – Males
Sweden 1816-1840
Modelled !Krung
Australia 1946-1948

Should we pay people to look after their health?


http://theconversation.com/should-we-pay-people-to-look-after-their-health-24012

Should we pay people to look after their health?

The key to using incentives may be to do so with a high enough frequency to create healthy habits. Health Gauge/Flickr, CC BY-SA

With the Tony Abbott government expressing concern about the growing health budget and emphasising personal responsibility, perhaps it’s time to consider some creative ways of curbing what Australia spends on ill health. One solution is to pay people to either get well or avoid becoming unwell in the first instance.

The United Kingdom is already doing this kind of thing with a current trial of giving mothers from disadvantaged suburbs A$340 worth of food vouchers for breastfeeding newborn babies. And from January 1 this year, employers in the United Statescan provide increasingly significant rewards to employees for having better health outcomes, as part of the Affordable Care Act.

But should people really be paid to make healthy choices? Shouldn’t they be motivated to improve their health on their own anyway?

Encouraging right decisions

People don’t do what’s in their best interest in the long term for many reasons. When making decisions we tend to take mental short cuts; we allow the desires and distractions of the moment get in the way of pursuing what’s best.

One such “irrationality” is our tendency to focus on the immediate benefits or costs of a situation while undervaluing future consequences. Known as present bias, this is evident every time you hit the snooze button instead of going for a morning jog.

Researchers have found effective incentive programs can offset present bias by providing rewards that make it more attractive to make the healthy choice in the present.

Research conducted in US workplaces, for instance, found people who were given US$750 to quit smoking were three times more successful than those who weren’t given any incentives. Even after the incentive was removed for six months, there was still a quit rate ratio of 2.6 between the incentive and control groups – 9.4% of the incentive group stayed cigarette-free versus only 3.6% of the control group.

A refined approach

Still, while research on using financial incentives to encourage healthy behaviours is promising, it isn’t as straightforward as doling out cash in exchange for good behaviour.

Standard economic theory posits that the higher the reward, the bigger the impact – but this is only one ingredient to success. Behavioural economics shows that when and how you distribute incentives can determine the success of the program.

Here are a few basic principles to consider. First, small rewards can have a big impact on behaviour if they’re provided frequently and soon after the healthy choice is made. We have found this to be true in the context of weight-loss programs, medication adherence, and even to quit the use of drugs such as cocaine.

Games of chance are an effective way of distributing rewards as research has found people tend to focus on the value of the reward rather than their chance of winning the prize. Many people think that a 0.0001 and a 0.0000001 chance of winning a prize are roughly equivalent even though in reality they are vastly different probabilities.

Finally, people are more influenced by the prospect of losses than by gains. Studies show people put much greater weight on losing something than gaining something of a similar value.

In one weight-loss experiment, for instance, participants were asked to place money into a deposit account. If they didn’t achieve their weight goals, the money would be forfeited, but if they were successful, the initial deposit would be doubled and theirs to keep.

Reluctant to lose their deposits, participants in the deposit group lost over three times more weight than the control group, who were simply weighed each month.

Creating good habits

Incentives are particularly effective at changing one-time behaviours, such as encouraging vaccination or attendance at health screenings. But with increasing rates of obesity and other lifestyle-related diseases, we need to focus on how incentives can be used to achieve habit formation and long-term sustained weight loss.

We know financial incentives can increase gym usage and positively impact weight, waist size and pulse rate, but how to sustain gym use after the incentive is removed? The key may be to use incentives to achieve a high frequency of attendance for long enough to create a healthy habit.

We also need to consider how we can leverage social incentives, such as peer support and recognition, together with new technologies to maximise the impact of incentive-based programs.

Innovative solutions, like paying people to encourage the right health choices, may help to reduce both the health and economic impact of Australia’s growing burden of disease.

Okham’s Razor – Limits to Growth – Kerryn Higgs

“The conscience and intelligent manipulation of the masses is an important element in democratic society. Those who manipulate this unseen mechanism constitute an invisible government that represents the true ruling power of our country. It is they who pull the wires that control the public mind.” Edward Bernaise (Sigmund Freud’s Cousin, Founder of modern PR)

http://www.abc.net.au/radionational/programs/ockhamsrazor/limits-to-growth/6088808

Limits to growth

Sunday 15 February 2015 7:45AM

Australian writer Dr Kerryn Higgs has written a book called Collision Course – Endless Growth On A Finite Planet, in which she examines how society’s commitment to growth has marginalized scientific findings on the limit of growth, calling them bogus predictions of imminent doom.

Transcript

Hide

Robyn Williams: Growth or no growth? You may have heard Dick Smith on Breakfasta couple of weeks ago saying that unlimited growth is impossible and we must do something else. But what? There is, of course, a way of improving what we do more efficiently and stopping waste. Peter Newman from Perth gave an example on Late Night Live late last year: If we used trains instead of trucks for freight, it would halve the costs and save many, many lives. We don’t do it because we always do what we’ve always done. Kerryn Higgs, who’s with the University of Tasmania, has just brought out a book called Collision Course – Endless Growth on a Finite Planet, published by MIT Press and she has recently been appointed a Fellow of the International Centre of the Club of Rome.


Kerryn Higgs: I came across The Limits to Growth quite by accident in 1972, just when it was published. It was commissioned by the Club of Rome and written by a team of researchers at MIT, led by Donella and Dennis Meadows. The book changed the way I thought about Nature, people, history, everything. It persuaded me that physics matters, and that the idea of ever-expanding economic growth is a delusion. Up to then, I was a mainstream humanities person, history being my main discipline, and writing my passion. I did grow up in the countryside and loved the natural world, but I had no real intuition of an impending environmental crisis. And here was this little book suggesting that if we carried on with our exponential expansion, our system would collapse at some point in the middle of the 21st century.


Although galloping economic growth already seemed normal to most younger people living in the developed world in 1972, the growth that took off after WW2 was not normal. It is absolutely unprecedented in all of history. Nothing like it has ever occurred before: large and rapidly growing populations, accelerating industrialisation, expanding production of every kind. All new. The Meadows team found that we could avoid collapse if we slowed down the physical expansion of the economy. But this would mean two very difficult changes— slowing human population growth and slowing the entire cycle of physical production from material extraction through to the disposal of waste. The book was persuasive to me and I expected its message to have an impact on human affairs. But as the years rolled by, it seemed there was very little—and then, even less. In fact, I gradually became aware that most people thought “the Club of Rome got it wrong” and scorned the book as an ignorant tract from “doomsters”, an especially common view among economists. I want to point out, though, that recent research from Melbourne University’s Graham Turner, shows that the Meadows team did not get it wrong. Their projections for what would happen if we carried on business as usual tally almost exactly with what has actually occurred in the 40 years since 1972.


But while scientists from Rachel Carson onwards sounded alarm about numerous problems associated with growth, this was not the case in our govern­ments, bureaucracies, and in public debate, where economic growth was gradually being entrenched as the central objective of collective human effort. This really puzzled me.


How come the Club of Rome got such a terrible press?


How did scientists lose credibility? When I was young, science was almost a god. A few decades later, scientists were being flippantly brushed aside.


How did economists displace scientists as the crucial policy advisors and the architects of public debate, setting the criteria for policy decisions?


How did economic growth become accepted as the only solution to virtually all social problems—unemployment, debt and even the environmental damage growth was causing?


And how did ever-increasing income and consumption become the meaning of life, at least for us in the rich world? It was not the meaning of life when I was young.


Answering these questions took me back through human history. A few developments were especially decisive.


Around 1900, the modern corporation emerged. Over just a decade or two, many of the current transnationals came into being in the US (with names like Coca Cola, Alcoa and DuPont). International Harvester amalgamated 85% of US farm machinery into one corporation in just a few years. Adam Smith’s free enterprise economy was being transformed into something very different. A process of perpetual consolidation followed and by now, frighteningly few corporations control the majority of world trade and revenue, giving them colossal power. The new corporations of the early 20thcentury banded together into industry associations and business councils like the immensely influential US Chamber of Commerce, which was formed out of local chambers from across the country in 1912. These organisations exploited the newly emerging Public Relations industry, launching a barrage of private enterprise propaganda, uninterrupted for more than a century, and still very healthy today. Peabody coal, for example, recently signed up one of the world’s PR giants, Burson-Marsteller, for a PR campaign to convince leaders that coal is the solution to poverty.


Back in 1910 universal suffrage threatened the customary dominance of the business classes, and PR was an excellent solution. If workers were going to vote, they’d need the right advice. No-one expressed it better than Edward Bernays, Freud’s nephew, who is credited with founding the PR industry. Bernays was candid:


The conscious and intelligent manipulation of the… masses is an important element in democratic society (he wrote). Those who manipulate this unseen mechanism … constitute an invisible government which is the true ruling power of our country… It is they who pull the wires which control the public mind.


PR became an essential tool for business to consolidate its power right through the century, culminating in the 1970s project to “litter the world with free market think tanks”. By 2013, there were nearly 7,000 of these, all over the world; the vast majority were conservative, free market advocates, many on the libertarian fringe, and financed by big business. They cultivate a studied appearance of independence, though one think tank vice-president came clean. “There is no such thing as a disinterested think tanker,” he said. “Somebody always builds the tank, and it’s usually not Santa Claus or the Tooth Fairy.” Funding think tanks is always about “shaping and reshaping the climate of public opinion”.


Nonetheless, the claim to independence has been so successful that most think tanks have tax-free charity status and their staff constantly feature in the media as if they were independent and peer-reviewed experts.


Another decisive development was the “bigger pie” strategy. Straight after World War 2, governments took on a new role of fostering growth. The emphasis increasingly fell on baking a bigger pie, so the slices could get bigger but the pie would not have to be divided up any more equitably. Growth could function as an alternative to fairness. Thorny problems like world poverty were designated growth problems and leaders in the decolonising world often embraced a growth-oriented version of development, a version that rarely helped their poor majorities. Growth allowed the privileged to maintain and even extend their opulence, while professing to be saving the world from poverty. It’s frequently claimed that growth is lifting millions out of poverty. But, apart from China, this is not really the case. China has indeed decreased the numbers of its extreme poor, though this has been achieved with disastrous environmental decline and increasing inequality.

Meanwhile, progress is patchy elsewhere. After 70 years of economic growth, with the world economy now 8 to 10 times bigger than it was in 1950, there are still 2 and a half billion people living on less than $2 a day, more than a third of the people on earth, and about the same number as in 1981. Growth has not been shared. Underlying the popularity of growth, there’s a great clash of values between mainstream economics and the physical sciences.


Economists see the human economy as the primary system—odd when you consider that the planet’s been here for about 4.6 billion years, and life for something like 3.8 billion.  The human era is less than a whisker on this timescale, but for economists Nature is just the extractive sector of their primary system, the economy. For scientists and ecological economists, the primary system is the planet – and it’s self-evidently finite. The human economy with its immense material extraction and vast waste, exists entirely within the earth system. Self-evident as these boundaries might seem, they remain invisible or contested in mainstream economics and are of little concern to politicians or citizens in most countries. Hardly a news bulletin goes by without stories of growth expected, growth threatened, or growth achieved. Growth is the watchword of both major parties here and around the world and remains the accepted solution to poverty, pollution and debt.


And yet, however necessary growth is to our current economic arrangements, and however desirable from the point of view of our expectations of material well-being and comfort, it’s hardly a practical aim if it’s based on a misperception of reality.


While we assume that a high and increasing level of material consumption is normal and desirable, we ignore the peculiarity of our times and the encroaching threats to us and our planet.


We are well into dangerous territory in three areas:


Firstly, species are going extinct 100 to 1000 times faster than the background rate.


Secondly, the nitrogen cycle is completely disrupted. In nature, nitrogen is largely inert in our atmosphere. Today, mainly through making fertiliser, nitrogen is flooding through our rivers, groundwater and continental shelves, fuelling algal blooms that lead to dead zones and fish kills.


And thirdly we are on the way to a very hot planet. Unless we change rapidly in the extremely near future, we risk an increase of 4 degrees Centigrade by 2100. So far, an increase of less than 1 degree is melting the West Antarctic icesheet, glaciers nearly everywhere and even the massive Greenland icecap.


Meanwhile, the rate of carbon dioxide and methane emissions continues to rise. In fact, right through the decade it took to write my book, I was staggered as these emissions defied all protocols and agreements, and rose faster and faster every year, setting a new record in 2013. Four degrees may be a bridge too far, and yet our culture is cheerfully crossing it.


I started out as a student of human history and ended up studying the intersection between human history and natural history. Humans have had local effects for thousands of years but on a global scale, the collision is new. Humans were a flea on the face of the earth for most of our history andit’s probably true to say this is the very first time one species—ours—has taken over the entire planetary system for its own sole use. In human-focused terms, this may seem perfectly reasonable. In planetary terms, it’s weird and completely impractical.


While our best agricultural land, last remnants of white box woodland and the Great Barrier Reef are put at risk for the extraction of gas and coal, which we should aim to stop burning anyway if we want a liveable world, it seems that only citizen revolt is left to counter it.


Let’s hope we succeed.


The ground of our being is at stake.


Robyn Williams: Kerryn Higgs. She’s with the University of Tasmania and her book, published by MIT Press, is called Collision Course – Endless Growth on a Finite Planet.Kerryn has recently been appointed a Fellow of the International Centre of the Club of Rome. Next week I shall introduce the proud Professor who’s just moved into that crumpled brown paper bag designed by Frank Gehry for the University of Technology, Sydney: Roy Green on innovation in Australia and what’s not right.


Guests

Dr Kerryn Higgs
Writer
University Associate
University of Tasmania
Fellow of the International Centre of the Club of Rome

Publications

Title
Collision Course – Endless Growth On A Finite Planet
Author
Kerryn Higgs
Publisher
MIT Press

Credits

Presenter
Robyn Williams
Producer
Brigitte Seega

Comments (3)

Add your comment


  • Peter Strachan :

    12 Feb 2015 6:57:48pm

    Thanks Kerryn for outlining the problem and much of its genesis. I find it interesting and frustrating that the obvious solution to our predicament is not mentioned.

    If we have a citizens revolt, and I believe that we will eventually come to that, what direction would this revolt take society? Call me old fashioned but I was rather hoping that human intellect could come to a better solution than amorphous revolt against the status quo.

    As we look around at existing resource constrained parts of our planet, there are already many visions of that citizens revolt already underway. In the Middle East, in North Africa, Rwanda, in eastern Europe and recently even on our doorstep in The Solomon Islands overpopulation, lack of water and unequal distribution of wealth has led to civil unrest and war, often cloaked in ethnic or religious garb to disguise its true cause.

    The solution is already in our hands and its called family planning or contraception if you like.

    It is clear that humanity will not be able to avert expansion of societal collapse which has already shown its early phase, while its population numbers keep rising by 80 million pa. Yet there is an unmet desire by women and men to plan and reduce fertility rates. Why are we not providing free choice to those who want this? Why do we continue to promote high birthrates?

    Within a decade, population growth rates could be significantly reduced and begin a necessary decline towards a more sustainable level.

    But who, apart from Kelvin Thompson is leading the charge? Perhaps more people should know of www.populationparty.org.au?


  • Stephen S :

    14 Feb 2015 9:43:10am

    Gillard and Burke made sure that Labor’s 2011 ‘Sustainable Population Strategy’ contained little factual information and studiously avoided all these pressing questions.

    For another generation I fear, the opportunity was lost for a serious national debate about Australia’s rigid postwar policy of sustained high population growth.


  • Michael Lardelli :

    14 Feb 2015 3:05:22pm

    An interesting talk Kerryn. As to the “why” of the current obsession with economic growth, the fault is in us. While, as individuals, we pretend to rationality, humans, as a group, do not act in this way. As the products of evolution by natural selection, we act to maximise reproduction – and pity the person who tries to argue against that! For males, greater wealth gives us more access to females. For females, greater wealth gives higher social status and more probable survival of children.

    The fact is that we NEED to believe in economic growth because, without that, we are forced to face up to the falsity of what I call “The Big Lie” – namely that we can all improve our lives / get rich. I wrote an essay on this a few years ago:

    http://www.onlineopinion.com.au/view.asp?article=13487&page=0

    When people are young they can be idealistic and believe that they can change the world. But that would require that the world be a rational place.

    When people are older and more cynical like me they realise that human irrationality is a surging tide against which nothing can stand. It will wash over the world and then retreat. All radically new biological innovations thrown up by Nature are like this. Just like a newly evolved microorganism sweeps through a host population wreaking destruction until it – and the host – evolve to commensality, so the new and incredibly adaptable human species will do the same, although how many thousands of years that will take is unknown.

    In the meantime, those of us who understand the inevitability of this process can find some small amount of solace by attempting to change things in our local community to enhance the survival of our own children, friends, neighbours and communities. At the local level, the rational part of one human can sometimes make a difference. And there is no sense in getting depressed about the inevitable.

What 200 Calories Look Like In Different Foods

What 200 Calories Look Like In Different Foods

Apples (385 grams / 13.5 oz)

Butter (28 grams / 0.98 oz)

Broccoli (588 grams / 20.7 oz)

Snickers Chocolate Bar (41 grams / 1.45 oz)

Cooked Pasta (145 grams / 5.11 oz)

Hot Dogs (66 grams / 2.33 oz)

Kiwi Fruit (328 grams / 11.6 oz)

Jack in the Box Cheeseburger (75 grams / 2.6 oz)

Eggs (150 grams / 5.3 oz)

Celery (1425 grams / 50.3 oz)

Blackberry Pie (56 grams / 1.97 oz)

Mini Peppers (740 grams / 26.1 oz)

Canned Black Beans (186 grams / 6.56 oz)

Werther’s Originals Candy (50 grams / 1.76 oz)

Jack in the Box Chicken Sandwich (72 grams / 2.5 oz)

Glazed Doughnut (52 grams / 1.8 oz)

French Sandwich Roll (72 grams / 2.5 oz)

Avocado (125 grams / 4.4 oz)

Canned Sweet Corn (308 grams / 10.9 oz)

Baby Carrots (570 gram / 20.1 oz)

Canned Green Peas (357 grams / 12.6 oz)

Canned Pork and Beans (186 grams / 6.56 oz)

Doritos (41 grams / 1.44 oz)

Dried Apricots (83 grams / 2.9 oz)

Jack in the Box French Fries (73 grams / 2.6 oz)

Fried Bacon (34 grams / 1.2 oz)

Fruit Loops Cereal (51 grams / 1.8 oz)

Grapes (290 grams / 10.2 oz)

Splenda Artifical Sweetener (50 grams / 1.8 oz)

Gummy Bears (51 grams / 1.8 oz)

Hershey Kisses (36 grams / 1.27 oz)

Honeydew Melon (553 grams / 19.5 oz)

Jelly Belly Jelly Beans (54 grams / 1.9 oz)

Ketchup (226 grams / 7.97 oz)

M&M Candy (40 grams / 1.4 oz)

Red Onions (475 grams / 16.75 oz)

Sliced Smoked Turkey (204 grams / 7.2 oz)

Coca Cola (496 ml / 16.77 oz)

Canola Oil (23 grams / 0.8 oz)

Smarties Candy (57 grams / 2 oz)

Tootsie Pops (68 grams / 2.4 oz)

Whole Milk (333 ml / 11.3 fl oz)

Balsamic Vinegar (200 ml / 6.8 fl oz)

Lowfat Strawberry Yogurt (196 grams / 6.9 oz)

Canned Chili con Carne (189 grams / 6.7 oz)

Canned Tuna Packed in Oil (102 grams / 3.6 oz)

Fiber One Cereal (100 grams / 3.5 oz)

Flax Bread (90 grams / 3.17 oz)

Blueberry Muffin (72 grams / 2.5 oz)

Bailey’s Irish Cream (60 ml / 2.02 fl oz)

Cranberry Vanilla Crunch Cereal (55 grams / 1.9 oz)

Cornmeal (55 grams / 1.94 oz)

Wheat Flour (55 grams / 1.94 oz)

Peanut Butter Power Bar (54 grams / 1.9 oz)

Puffed Rice Cereal (54 grams / 1.9 oz)

Puffed Wheat Cereal (53 grams / 1.87 oz)

Brown Sugar (53 grams / 1.87 oz)

Salted Pretzels (52 grams / 1.83 oz)

Medium Cheddar Cheese (51 grams / 1.8 oz)

Potato Chips (37 grams / 1.3oz)

Sliced and Toasted Almonds (35 grams / 1.23 oz)

Peanut Butter (34 grams / 1.2 oz)

Salted Mixed Nuts (33 grams / 1.16 oz)

report

Fat adults, fat kids, fat pets: how we’re driving the obesity pandemic


http://www.smh.com.au/national/health/fat-adults-fat-kids-fat-pets-how-were-driving-the-obesity-pandemic-20141205-120cbb.html

Fat adults, fat kids, fat pets: how we’re driving the obesity pandemic

 Science Editor

New research finds that obesity has become a major pandemic and looks set to get worse – in animals as well as humans, writes Nicky Phillips.

Bulging issue: Processed foods and climate change are hastening the obesity pandemic.Bulging issue: Processed foods and climate change are hastening the obesity pandemic. Photo: iStock

In the year 2000 when Cathy Freeman smashed the women’s 400-metre record at the Sydney Olympics, showcasing the best of our species’ physical abilities, the physique of many others crossed another, less auspicious line.

In that year the number of overweight people surpassed the number of people who were underweight.

While malnutrition remains a scourge in many parts of the third world, obesity elsewhere is now considered a pandemic – a global epidemic that has emerged in recent decades and costs Australia about $21 billion a year.

But it’s not just people battling the bulge.

The data is showing that pets and companion animals – such as cats, dogs and horses – have also dramatically increased in girth.

“There is something about our shared environment that is generating obesity in both humans and our companion animals,” says Professor David Raubenheimer, a nutritional ecologist at the University of Sydney’s Charles Perkins Centre.

A chief driver is economics, he says. Since the 1980s ultra-processed foods, which are cheaper than whole foods but far less nutritious, have flooded supermarkets and fast-food stores.

Climate change is also a factor, as higher concentrations of carbon dioxide diminish  the nutrient quality of plants and crops, which are the basis of human and many animals’ diets.

The idea that environment plays a major role in the obesity epidemic is not new. But Raubenheimer’s work is trying to unravel the complex mechanisms that make the modern world we’ve created for ourselves an uneasy fit for our bodies, which evolved in a very different landscape more than 100,000 years ago.

“It’s only by properly understanding problems that we can hope to predict, avert or manage them,” says Raubenheimer, who notes that not a single country has yet reversed its obesity epidemic.

To understand the role of the environment on obesity, there are a few things to note about our internal workings.

All animals, including humans, have sophisticated internal appetite systems that influence food intake to ensure the body receives the correct balance of each major nutrient group: protein, fat and carbohydrates.

Research by Raubenheimer and his colleagues found protein to be the most dominant of these nutrient “appetites”. Their studies in animals and people consistently show individuals will overeat fats and carbohydrates in order to meet their protein requirement.

Given that early humans evolved in an environment where meals likely consisted of lean game and root plants, both of which contained little fat or sugars, a strong protein appetite makes sense.

But now think of the modern world, where sugary, fatty and highly-processed foods – such as pizza, muesli bars, cereals, burgers and biscuits – are cheap and plentiful. Eating a greater quantity of those foodstuffs will not satisfy the protein appetite, but they are often consumed in place of protein because “protein costs more”, says Raubenheimer.

Studies in middle- and high-income countries consistently find that people living in poorer communities are more likely to be overweight or obese.

“The global rise of ultra-processed products, largely driven by powerful trans-national corporations, began in the 1980s and thus coincides closely with the period in which there has been a doubling in the rates of obesity,” wrote Raubenheimer, in his study published in theBritish Journal of Nutrition in November.

This may also suggest why dogs have beefed up by a whopping 33 percent, on average, and cats by 25 percent over the past few decades.

“If it’s more expensive to buy protein balanced foods for ourselves, imagine economically stressed families’ response when they feed their pets,” he says.

But it’s not just multinationals affecting food quality.

Climate change is diluting the nutrients in plants, because when exposed to high temperatures and a carbon dioxide-rich environment, the percentage of protein and fibre in plant leaves drops, while the concentration of sugars and starches increases.

“There is an immense amount of research showing that one consistent impact of climate change is the nutritional composition of plants,” Raubenheimer says.

Given that plants make up 80 per cent of the human diet, Raubenheimer predicts that vegetables and crops diluted of protein will become another factor in encouraging humans to overeat fats and carbohydrates to satiate their protein requirements.

Raubenheimer’s analysis suggests the impact of global warming on obesity rates will reach beyond plants to livestock animals that eat the plants, which people in turn consume as a major protein source.

If cattle and sheep graze on grasses with lower concentrations of the nutrient, they in turn will overeat to satiate their protein appetite, increasing their body weight, he says.

And while protein is a major driver of appetite, exposure to too much early in life may do more harm than good.

Numerous studies have found that babies fed formula, which has a higher concentration of protein than breast milk, are more likely to become obese later in life than breast-fed infants.

Raubenheimer says one explanation for this trend is that feeding infants high protein foods may be conditioning them to have a higher protein appetite for life.

“[This] is potentially causing those infants to overeat fats and carbs to a greater extent to satisfy their protein requirements,” he says.

While Raubenheimer and his collaborators at the Charles Perkins Centre know obesity emerges from a complex set of interactions between the environment, genetics and lifestyle factors, new approaches are desperately needed to tackle the problem, he says.

“We need interdisciplinary research, where approaches and concepts from multiple areas are applied to this major global crisis.”

Yach: Changing the Landscape for Prevention and Health Promotion


http://www.huffingtonpost.com/dr-derek-yach/changing-the-landscape-fo_1_b_6439328.html

Changing the Landscape for Prevention and Health Promotion

Posted: Updated:

By Bridget B. Kelly and Derek Yach*

Chronic diseases like heart disease, diabetes, and cancer are major contributors to poor health and rising health care costs in the U.S. The cost of treating these conditions is estimated to account for 80 percent of annual health care expenditures. More and more, experts agree on the great potential for preventing or delaying many cases of costly chronic diseases by focusing on environmental, social, and behavioral root influences on health. Yet the U.S. has been slow to complement its considerable spending on biomedical treatments with investments in population-based and non-clinical prevention interventions.

What is getting in the way of strengthening our investments in prevention and health promotion? A few consistent themes emerged across multiple expert consensus studies conducted by the Institute of Medicine (IOM), which were summarized in the report Improving Support for Heath Promotion and Chronic Disease Prevention — developed in support of the recent Vitality Institute Commission on Health Promotion and Prevention of Chronic Disease in Working-Age Americans.

First, prevention is challenging — chronic health problems are complex, and so are the solutions. Second, decision-makers who allocate resources have tough choices to make among many competing pressures and priorities; prevention and promotion can be at a disadvantage because their benefits are delayed. Third, there is a need for better, more usable evidence related to the effectiveness, the implementation at scale, and the economics of prevention interventions. Decision-makers need information that makes it easier to understand, identify, and successfully implement prevention strategies and policies. As noted in a recent opinion piece in the Journal of the American Medical Association (JAMA), limited investment in prevention research has resulted in an inaccurate perception that investing in preventive measures is of limited value. This has profound implications for federal funding allocations.

The mismatch in funding allocations is seen right at the source of our nation’s major investment in new health-related knowledge: the National Institutes of Health (NIH). A new paper in the American Journal of Preventive Medicine found that less than 10 percent of the NIH annual budget for chronic diseases is allocated to improving our knowledge base for effective behavioral interventions to prevent chronic diseases. This means that despite the immense potential for prevention science to reduce the burden of chronic diseases in the U.S., it is woefully underfunded compared to what we invest in researching biomedical treatment interventions for these conditions. NIH investments affect what evidence is ultimately available to those who decide how to allocate resources to improve the health of our nation, and they also affect the kinds of health experts we train as a country. By not investing in prevention science and in a future generation of scientists capable of doing high quality research in prevention, we are perpetually caught in the same vicious cycle where prevention continues to lag behind in our knowledge and therefore our actions.

There is hope that the landscape is slowly changing. Initiatives such as the NIH Office of Disease Prevention‘s Strategic Plan for 2014-2018 and the Affordable Care Act’s mandated Patient-Centered Outcomes Research Institute (PCORI) have the potential to strengthen prevention science and build the evidence-base for effective prevention interventions. Innovations in personalized health technologies and advances in behavioral economics also show great promise in improving health behaviors for chronic disease prevention.

The Vitality Institute Commission’s report emphasized the need for faster and more powerful research and development cycles for prevention interventions through increased federal funding for prevention science as well as the fostering of stronger public-private partnerships. It is essential to generate and communicate evidence in a way that enables decision-makers to understand the value of investing in prevention while taking into account their priorities, interests and constituencies. This will lead us to more balanced investments, make prevention a national priority, and boost the health of the nation.

*The authors are responsible for the content of this article, which does not necessarily represent the views of the Institute of Medicine.

Amplio – surgeon score cards

https://medium.com/backchannel/should-surgeons-keep-score-8b3f890a7d4c

Making the Cut

Which surgeon you get matters — a lot. But how do we know who the good ones are?

“You can think of surgery as not really that different than golf.” Peter Scardino is the chief of surgery at Memorial Sloan Kettering Cancer Center (MSK). He has performed more than 4,000 open radical prostatectomies. “Very good athletes and intelligent people can be wildly different in their ability to drive or chip or putt. I think the same thing’s true in the operating room.”

The difference is that golfers keep score. Andrew Vickers, a biostatistician at MSK, would hear cancer surgeons at the hospital having heated debates about, say, how often they took out a patient’s whole kidney versus just a part of it. “Wait a minute,” he remembers thinking. “Don’t you know this?”

“How come they didn’t know this already?”

In the summer of 2009, he and Scardino teamed up to begin work on a software project, called Amplio (from the Latin for “to improve”), to give surgeons detailed feedback about their performance. The program—still in its early stages but already starting to be shared with other hospitals — started with a simple premise: the only way a surgeon is going to get better is if he knows where he stands.

Vickers likes to put it this way. His brother-in-law is a bond salesman, and you can ask him, How’d you do last week?, and he’ll tell you not just his own numbers, but the numbers for his whole group.

Why should it be any different when lives are in the balance?

Andrew Vickers

The central technique of Amplio, using outcome data to determine which surgeons were more successful, and why, takes on a powerful taboo. Perhaps the longest-standing impediment to research into surgical outcomes — the reason that surgeons, unlike bond salesmen (or pilots or athletes), are so much in the dark about their own performance — are the surgeons themselves.

“Surgeons basically deeply believe that if I’m a well-trained surgeon, if I’ve gone through a good residency program, a fellowship program, and I’m board-certified, I can do an operation just as well as you can,” Scardino says. “And the difference between our results is really because I’m willing to take on the challenging patients.”

It is, maybe, a vestige of the old myth that anyone ordained to cut into healthy flesh is thereby made a minor god. It’s the belief that there are no differences in skill, and that even if there were differences, surgery is so complicated and multifaceted, and so much determined by the patient you happen to be operating on, that no one would ever be able to tell.

Vickers said to me that after several years of hearing this, he became so frustrated that he sat down with his ten­-year-­old daughter and conducted a little experiment. He searched YouTube for “radical prostatectomy” and found two clips, one from a highly respected surgeon and one from a surgeon who was rumored to be less skilled. He showed his daughter a 15­second clip of each and asked, “Which one is better?”

“That one,” she replied right away.

When Vickers asked her why, “She looked at me, like, can’t you tell the difference? You can just see.”

Would you want to be cut by this surgeon?

Or this one?

A remarkable paper published last year in the New England Journal of Medicine showed that maybe Vickers’s daughter was onto something.

In the study, run by John Birkmeyer, a surgeon who at the time was at the University of Michigan, bariatric surgeons were recruited from around the state of Michigan to submit videos of themselves doing a gastric bypass operation. The videos were sent to another pool of bariatric surgeons to be given a series of 1-to-5 rating on factors such as “respect for tissue,” “time and motion,” “economy of movement” and “flow of operation.”

The study’s key finding was that not only could you reliably determine a surgeon’s skill by watching them on video — skill was nowhere near as nebulous as had been assumed — but that those ratings were highly correlated with outcomes: “As compared with patients treated by surgeons with high skill ratings, patients treated by surgeons with low skill ratings were at least twice as likely to die, have complications, undergo reoperation, and be readmitted after hospital discharge,” Birkmeyer and his colleagues wrote in the paper.

You can actually watch a couple of these videos yourself [see above]. Along with the overall study results, Birkmeyer published two short clips: one from a highly rated surgeon and one from a low-rated surgeon. The difference is astonishing.

You see the higher-rated surgeon first. It’s what you always imagined surgery might look like. The robot hands move with purpose — quick, deliberate strokes. There’s no wasted motion. When they grip or sew or staple tissue, it’s with a mix of command and gentle respect. The surgeon seems to know exactly what to do next. The way they’ve set things up makes it feel roomy in there, and tidy.

Watching the lower-rated surgeon, by contrast, is like watching the hidden camera footage of a nanny hitting your kid: it looks like abuse. The surgeon’s view is all muddled, they’re groping aimlessly at flesh, desperate to find purchase somewhere, or an orientation, as if their instruments are being thrashed around in the undertow of the patient’s guts. It’s like watching middle schoolers play soccer: the game seems to make no sense, to have no plot or direction or purpose or boundary. It’s not, in other words, like, “This one’s hands are a bit shaky,” it’s more like, “Does this one have any clue what they’re doing?”

It’s funny: in other disciplines we reserve the word “surgical” for feats that took a special poise, a kind of deftness under pressure. But the thing we maybe forget is that not all surgery is worthy of the name.

Vickers is best known for showing exactly how much variety there is, plotting, in 2007, the so-called “learning curve” for surgery: a graph that tracks, on one axis, the number of cases a surgeon has under his belt, and on the other, his recurrence rates (the rate at which his patients’ cancer comes back).

As surgeons get more experience, their patients do better. This “learning curve” shows patients’ 5 year cancer-free rates rise with procedure volume.

He showed that in incidents of prostate cancer that haven’t spread beyond the prostate — so-called ‘organ-confined’ cases — the recurrence rates for a novice surgeon were 10 to 15%. For an experienced surgeon, they were less than 1%. With recurrence rates so low for the most experienced surgeons, Vickers was able to conclude that in organ-confined cancer cases, the onlyreason a patient would recur is “because the surgeon screwed up.”

There’s a large literature, going back to a famous paper in 1979, finding that hospitals with higher volumes of a given surgical procedure have better outcomes. In the ’79 study it was reported that for some kinds of surgery, hospitals that saw 200 or more cases per year had death rates that were 25% to 41% lower than hospitals with lower volumes. If every case were treated at a high-volume hospital, you would avoid more than a third of the deaths associated with the procedure.

But what wasn’t clear was why higher volumes led to better outcomes. And for decades, researchers penned more than 300 studies restating the same basic relationship, without getting any closer to explaining it. Did low-volume hospitals end up with the riskiest patients? Did high-volume hospitals have fancier equipment? Or better operating room teams? A better overall staff? An editorial as late as 2003 summarized the literature with the title, “The Volume–Outcome Conundrum.”

A 2003 paper by Birkmeyer, “Surgeon volume and operative mortality in the United States,” was the first to offer definitive evidence that the biggest factor determining the outcome of many surgical procedures — the hidden element that explained most of the variation among hospitals — was the procedure volume not of the hospital, but of the individual surgeons.

“In general I don’t think anyone was surprised that there was a learning curve,” Vickers says. “I think they were surprised at what a big difference it made.” Surprised, maybe, but not moved to action. “You may think that everyone would drop what they were doing,” he says, “and try and work out what it is that some surgeons are doing that the other ones aren’t… But things move a lot more slowly than that.”

Tired of waiting, Vickers started sharing some initial ideas with Scardino about the program that would become Amplio. It would give surgeons detailed feedback about their performance. It would show you not just your own results, but the results for everyone in your service. If another surgeon was doing particularly well, you could find out what accounted for the difference; if your own numbers dropped, you’d know to make an adjustment. Vickers explains that they wanted to “stop doing studies showing surgeons had different outcomes.”

“Let’s do something about it,” he told Scardino.

Dr. Scardino

The first time I heard about Amplio was on the third floor of the Chrysler Building, in a room they called the Innovation Lab — the very room you’d point to if the Martians ever asked you what a 125-year old bureaucracy looks like. As I arrived, the receptionist was trying to straighten up a small mess of papers, post-its, cookies, and coffee stirrers. “The last crowd had a wild time,” she said. Every surface in the room was gray or off-white, the color of questionable eggs. It smelled like hospital-grade hand soap.

The people who filed in, though, and introduced themselves to each other (this was a summit of sorts, a “Collaboration Meeting” where different research groups from around MSK shared their works in progress) looked straight out of a well-funded biotech startup. There was a Fulbright scholar; a double-major in biology and philosophy; a couple of epidemiologists; a mathematician; a master’s in biostats and predictive analytics. There were Harvards, Cals, and Columbias, bright-eyed and sharply dressed.

Vickers was one of the speakers. He’s in his forties but he looks younger, less like an academic than a seasoned ski instructor, a consequence, maybe, of the long wavy hair, or the well-worn smile lines around his eyes, or this expression he has that’s like a mix of relaxed and impish. He leans back when he talks, and he talks well, and you get the sense that he knows he talks well. He’s British, from north London, educated first at Cambridge and then, for his PhD in clinical medicine, at Oxford.

The first big task with Amplio, he said, was to get the data. In order for surgeons to improve, they have to know how well they’re doing. In order to know how well they’re doing, they have to know how well their patients are doing. And this turns out to be trickier than you’d think. You need an apparatus that not only keeps meticulous records, but keeps them consistently, and throughout the entire life cycle of the patient.

That is, you need data on the patient before the operation: How old are they? What medications are they allergic to? Have they been in surgery before? You need data on what happened during the operation: where’d you make your incisions? how much blood was lost? how long did it take?

And finally, you need data on what happened to the patient after the operation — in some cases years after. In many hospitals, followup is sporadic at best. So before the Amplio team did anything fancy, they had to devise a better way to collect data from patients. They had to do stuff like find out whether it was better to give the patient a survey before or after a consultation with their surgeon? And what kinds of questions worked best? And who were they supposed to hand the iPad to when they were done?

Only when all these questions were answered, and a stream of regular data was being saved for every procedure, could Amplio start presenting something for surgeons to use.

A screen in Amplio shows how a surgeon’s patients are doing against their colleagues’

After years of setup, Amplio now is in a state where it can begin to affect procedures. The way it works is that a surgeon logs into a screen that shows where they stand on a series of plots. On each plot there’s a single red dot sitting amid some blue dots. The red dot shows your outcomes; the blue dots show the outcomes for each of the other surgeons in your group.

You can slice and dice different things you’re interested in to make different kinds of plots. One plot might show the average amount of blood lost during the operation against the average length of the hospital stay after it. Another plot might show a prostate patient’s recurrence rates against his continence or erectile function.

There’s something powerful about having outcomes graphed so starkly. Vickers says that there was a surgeon who saw that they were so far into the wrong corner of that plot — patients weren’t recovering well, and the cancer was coming back — that they decided to stop doing the procedure. The men spared poor outcomes by this decision will never know that Amplio saved them.

It’s like an analytics dashboard, or a leaderboard, or a report card, or… well, it’s like a lot of things that have existed in a lot of other fields for a long time. And it kind of makes you wonder, why has it taken so long for a tool like this to come to surgeons?

The answer is that Amplio has cleverly avoided the pitfalls of some previous efforts. For instance, in 1989, New York state began publicly reporting the mortality rates of cardiovascular surgeons. Because the data was “risk-adjusted”—an unfavorable outcome would be considered less bad, or not counted at all, if the patient was at risk to begin with — surgeons started pretending their patients were a lot worse off than they were. In some cases, they avoided patients who looked like goners. “The sickest patients weren’t being treated,” Vickers says. One investigation into why mortality in New York had dropped for a certain procedure, the coronary artery bypass graft, concluded that it was just because New York hospitals were sending the highest-risk patients to Ohio.

Vickers wanted to resist such gaming. But the answer is not to quit adjusting for patient risk. After all, if a given report says that your patients have 60% fewer complications than mine, does that mean that you’re a 60% better surgeon? It depends on the patients we see. It turns out that maybe the best way to prevent gaming is just to keep the results confidential. That sounds counter to a patient’s interests, but it’s been shown that patients actually make little use of objective outcomes data when it’s available, that in fact they’re much more likely to choose a surgeon or hospital based on reputation or raw proximity.

With Amplio, since patients, and the hospital, and even your boss are blinded from knowing whose results belong to whom, there’s no incentive to fudge risk factors or insist that a risk factor’s weight be changed, unless you think it’s actually good for the analysis.

That’s why Amplio’s interface for slicing and dicing the data in multiple ways matters, too. Feedback systems in the past that have given surgeons a single-dimensional report — say, they only track recurrence rates — have failed by creating a perverse incentive to optimize along just that one dimension, at the expense of all the others. Another reminder that feedback is, like surgery itself, fraught with complication: if you do it wrong, it can be worse than useless.

Every member of the Amplio team I spoke to stressed this point over and over again, that the system had been painstakingly built from the “bottom up” — tuned via detailed conversations with surgeons (“Are you accounting for BMI? What if we change the definition of blood loss?”) — so that the numbers it reported would be accurate, and risk-adjusted, and multidimensional, and credible. Because only then would they be actionable.

Karim Touijer, a surgeon at MSK who has used Amplio, explains the system’s chief benefit is the fact that you can vividly see how you’re doing, and that someone else is doing better. “When you set a standard,” he says, “the majority of people will improve or meet that standard. You tend to shrink the outliers. If I’m an outlier, if my performance leaves something to be desired, then I can go to my colleagues and say what is it that you’re doing to get these results?” Touijer sees this as the gradual standardization of surgery: you find the best performers, figure out what makes them good, and spread the word. He said that already within his group, because the conversations are more tied to outcomes, they’re talking about technique in a more objective way.

In fact, he says, as a result of Amplio he and his team have devised the first randomized clinical trial that is solely dedicated to surgical maneuvers.

Touijer specializes in the radical prostatectomy, considered one of the most complex and delicate operations in all of surgical practice. The procedure — in which a patient’s cancerous prostate is entirely removed — is highly sensitive to an individual surgeon’s skill. The reason is that the cancer ends up being very close to the nerves that control sexual and urinary function. It’s an operation unlike, say, kidney cancer, where you can easily go widely around the cancer. If you operate too far around the prostate, you could easily damage the rectum, the bladder, the nerves responsible for erection, or the sphincter responsible for urinary control. “It turns out that radical prostatectomy is very, very intimately influenced by surgical technique,” Touijer says. “One millimeter on one side or less than a millimeter on the other can change the outcome.”

Option B in the first A/B test for surgery: “A second bite is taken deeply into the fascia of the lateral pelvic fascia”

There’s a moment during the procedure where the surgeon has to decide whether to make a particular stitch. Some surgeons do it, some don’t; we don’t yet know which way is better. In the randomized trial, if the surgeon doesn’t have a compelling reason to pick one of the two alternatives, he lets the computer decide randomly for him. With enough patients, it should be possible to isolate the effect of that one decision, and to find out whether the extra stitch leads to better outcomes. The beauty is, since the outcomes data was already being tracked, and the patients were already going to have the surgery, the trial costs almost nothing.

If you’ve worked on the web, this model of rapid, cheap experimentation probably sounds familiar: what Touijer is describing is the first A/B test for surgery. As it turns out this particular test didn’t yield significant results. But several other tests are in the works, and some may improve some specific surgical techniques—improving the odds for all patients.

In Better, Atul Gawande argues that when we think of improving medicine, we always imagine making new advances, discovering the gene responsible for a disease, and so on — and forget that we can simply take what we already know how to do, and figure out how to do it better. In a word, iterate.

“But to do that,” Scardino says, “we have to measure it, we have to know what the results are.”

Scardino describes how when laparascopy was first becoming an option for radical prostatectomy, there was a lot of hype. “The company and many doctors who were doing it immediately claimed that it was safer, had better results, was more likely to cure the cancer and less likely to have permanent urinary or sexual problems.” But, he says, the data to support it were weak, and biased. “We could see in Amplio early on that as people started doing robotic surgery, the results were clearly worse.” It took time for them to hit par with the traditional open procedure; it took time for them to get better.

After a pilot among prostate surgeons, Amplio spread quickly to other services within MSK, including for kidney cancer, bladder cancer and colorectal cancer. Vickers’s team has been working with other hospitals — including Columbia in New York, the Barbara Ann Karmanos Cancer Institute in Michigan, and the MD Anderson Cancer Center in Texas — to slowly begin integrating with their systems. But it’s still early days: even within their own hospital, surgeons were wary of Amplio. It took many conversations, and assurances, to convince them that the data were being collected for their benefit — not to “name and shame” bad performers.

We know what happens when performance feedback goes awry — similar efforts to “grade” American schoolteachers, for instance, have perhaps generated more controversy than results. To do performance feedback well requires patience, and tact, and an earnest imperative to improve everyone’s results, not just to find the negative outliers. But Vickers believes that enough surgeons have signed on that the taboo has been broken at MSK. And results are bound to flow from that.

It’s all about trust. Remember the Birkmeyer study that compared surgeons using videos? It was only possible because Birkmeyer had built up relationships by way of a previous outcomes experiment in Michigan that meticulously protected data. “That’s a question that we get really frequently,” Birkmeyer told me when we spoke about the paper. “How on earth did we ever pull that study off?” The key, he says, is that years of research with these surgeons had slowly built goodwill. When it came time to make a big ask, “the surgeons were at a place where they could trust that we weren’t gonna screw them.”

Amplio will no doubt have to be able to say the same thing, if it’s to spread beyond the country’s best research cancer centers into the average regional hospital.

In 1914, a surgeon at Mass General got so fed up with the administration, and their refusal to measure outcomes, that he created his own private hospital, “the End Result Hospital,” where detailed records were to be kept of every patient’s “end results.” He published the first five years of his hospital’s cases in a book that became one of the founding documents of evidence-based medicine.

“The Idea is so simple as to seem childlike,” he wrote, “but we find it ignored in all Charitable Hospitals, and very largely in Private Hospitals. It is simply to follow the natural series of questions which any one asks in an individual case: What was the matter? Did they find it out beforehand? Did the patient get entirely well? If not — why not? Was it the fault of the surgeon, the disease, or the patient? What can we do to prevent similar failures in the future?”

It might finally be time for that simple, “childlike” concept to reach fruition. It’s like Vickers said to me one night in early November, as we were discussing Amplio, “Having been in health research for twenty years, there’s always that great quote of Martin Luther King: The arc of history is long, but it bends towards justice.”

The Key to Changing Individual Health Behaviors: Change the Environments That Give Rise to Them


http://harvardpublichealthreview.org/the-key-to-changing-individual-health-behaviors-change-the-environments-that-give-rise-to-them/

The Key to Changing Individual Health Behaviors: Change the Environments That Give Rise to Them

PDF: HPHRv2-Stulberg

Over the past four decades, the United States has faced steadily rising rates of obesity and associated chronic conditions. Many of these chronic conditions are rooted in nutrition and physical activity behaviors, and are often referred to as lifestyle diseases. Historically, the prevention of lifestyle diseases has focused on changes in individual behavior and personal choices, and personal responsibilities. However, a growing body of research has demonstrated the strong influence of physical and social surroundings on individuals’ actions. The context in which options are presented can shape the decision-making processes that impact health. Altogether, the research suggests that altering environments may be an effective driver of behavior change. 1Intentionally designing environments to promote healthy behaviors holds promise to reverse the increase of lifestyle diseases.

The emerging field of behavioral science – which gathers insights from disciplines like behavioral economics, cognitive psychology, and social psychology – illustrates that while individuals retain “free choice,” their environment significantly influences the choices they make, and in some instances, may lead them to act in ways that are counter to their true preferences. 2 A few examples:

  • Individual preferences are often inconsistent over time, especially in situations where immediate pleasures carry long term consequences. In a study that asked [hypothetically] if people would prefer fruit or chocolate as a future snack, 74% chose fruit. But, when those same participants were presented with both fruit and chocolate in real-time, 70% selected chocolate. 3
  • A person’s actions can be dramatically influenced by related contextual features. For instance, research shows that kitchenware size significantly influences serving and eating behavior. In a series of studies, individuals who were given larger bowls served themselves between 28-32% more cereal than those given smaller bowls. Studies also report that people tend to eat 90-97% of what is on their plate, irrespective of plate size. 4
  • People tend to consent to the “default option.” This has been observed in numerous situations ranging from deciding whether or not to become an organ donor to making saving allocations for retirement. For example, organ donation rates are 4% in Denmark and 12% in Germany where the default option is “opt-in.” In contrast, the rates are 86% in Sweden and nearly 100% in Austria where the default option is “opt-out.” Cultural differences cannot explain the discrepancy. 5

When these behavioral science insights are applied in the context of health, the growth of lifestyle diseases is not surprising. This expanding body of research sheds light on the difficulties of healthy living when society is dominated by the marketing of unhealthy foods and unduly large portion sizes, and where sedentary behavior is often the default option.

The good news is that the same forces that currently promote unhealthy behaviors can be used to encourage healthy ones. In their bestselling book Nudge, Richard Thaler and Cass Sunstein described “choice architecture,” or the proactive designing of environments that “nudge” people to make healthier selections while still retaining freedom of choice. 6 There are many opportunities to apply this concept to promoting healthy behaviors. In particular, given their resources, broad reach, and financial and social incentives, both governments and employers are in a unique position to promote healthy behaviors in a way that would affect many lives.

Government food programs such as the Supplemental Nutrition Assistance Program (“SNAP”) and the school lunch program could be designed to make healthy selections more accessible, and in some cases, the default options. Those that oppose the trend toward encouraging healthier foods often cite added costs and waste, arguing that children don’t like healthy foods and will throw them away uneaten. But the data tell a different story. A recent study in Childhood Obesity found that a vast majority of middle-school and high-school students like the updated and significantly healthier school lunch that was introduced in 2012. 7

Nonetheless, making the change is not cost-free. A recent meta-analysis found that the healthiest diets cost $1.50 more per-person, per-day, which amounts to $550 per-person, per-year. 8 While this amount is not insignificant, it pales in comparison to the cost of treating most diet-related chronic conditions. Designing government food programs around the “healthiest diets” may yield a positive return on investment.

Even so, many individuals – including those who do qualify for SNAP, as well as those who do not qualify for SNAP (i.e. incomes just about the SNAP cut-off) – may still struggle with affordability and availability of healthy foods. Perhaps the most sustainable and far-reaching approach to making healthy foods more accessible is to change food policies (e.g., subsidies) that currently favor the production and systematic delivery of unhealthy foods to favor healthy ones. This would likely lead to higher volumes, more efficient delivery, and lower costs for nutritious foods.

The government can also promote healthier eating by improving nutrition labeling. While the FDA’s recent proposal to ensure that serving sizes listed on food products reflect actual average consumption (e.g., nutrition specifications would reflect an entire muffin, not one-third of a muffin) is a small step in the right direction, there is potential to go a lot further. Research suggests that catchier and simplified nutrition labels could have a much greater impact on consumer behavior. 9 For example, NuVal, an independently designed system that gives food items a single overall score based on more than 30 nutrient and nutrition factors, could be considered for more widespread adoption. 10 Not only does NuVal make for easier interpretation of a product’s nutrition profile, it also enables comparison shopping between options and encourages people to “trade-up” to healthier options. 11 An additional model to consider is a traffic-light rating system that marks foods with either a green, yellow, or red light. In instances where it has already been implemented (in some private organizations and outside the United States), the traffic-light model has increased consumer awareness of health and leads to healthier purchases. 12

In addition to promoting a healthy diet, government should play an active role in encouraging physical activity through the education system (e.g., ensure the existence of meaningful recess and gym programs), transportation system (e.g., create options for safe pedestrian/bike commuting), and by supporting relevant community resources (e.g., building, maintaining, and ensuring the safety of outdoor parks and recreation centers). When options for physical activity are easily accessible, people tend to be more active. For example, a recent study published in the American Journal of Public Health illustrated that the establishment of traffic-free cycling and walking routes increased overall physical activity among those that lived nearby. 13

Employers may have the ability and incentives to move faster than government in designing health promoting environments. A healthier workforce results in both reduced health care costs and absenteeism, and in increased productivity. Recent data from the Society of Human Resource Management’s annual Employee Benefits Survey shows that employers are taking notice and increasing their investment in workforce wellness programs. While these programs have traditionally focused on offering employees classes, counseling, and incentives for healthy behaviors such as discounts on insurance premiums, subtler tweaks to the workplace itself could prove just as, if not more effective.

An example of these subtler changes is happening at Google. There, company leaders have invested in promoting employee nutrition and health. Instead of relying solely on traditional programs such as nutrition counseling and weight-loss classes, Google redesigned cafeterias to encourage healthier eating. Now, the most nutritious options are positioned at the front of the cafeteria and unhealthy foods are hidden in corners and placed in opaque bowls. Smaller plates are the norm and marked with reminder messages that “bigger dishes prompt people to eat more.” Foods are tagged with either red “warning” stickers, or green stickers signifying healthy foods. Beverage coolers stock water at eye level, and relegate sweetened beverages to the bottom where they are not as easily seen or accessed. These changes – which notably do not restrict options, but simply rearrange the way options are presented – have led to dramatic reductions in candy and sugar-sweetened beverage consumption, and increases in the use of smaller plates. 14 15

To encourage physical activity, employers can adopt similar approaches to workplace design, such as centrally located staircases and ergonomically fit workstations. Further, similar to current LEED certifications for environmentally-friendly buildings, there could also be a meaningful certification for health-promoting buildings. In addition to the design of physical workplaces, the way that work itself is conducted can also be designed to promote health. For example, some employers have made “walking meetings” a cultural norm to build physical activity into otherwise sedentary jobs. 16


Other Considerations

While the value of these environmental interventions is promising, there is a need for additional research that focuses on cost effectiveness. This is especially true if we hope to see increased governmental action, where broad policy implementation almost always follows a positive cost/benefit analysis. That said, some of the ideas – such as using smaller plates in government cafeterias or simplifying nutrition labels – come at relatively little additional financial cost, and have already demonstrated health-promoting benefits. These ideas could be fast-tracked for more widespread adoption.

Another potential barrier that must be overcome is the political power of special interests groups that rely on built-environments conducive to unhealthy behaviors. For example, a large part of the reason that the migration to healthier school lunches has taken so long is because various food interests have launched strong lobbying campaigns against such changes. 17 In order to transition entrenched unhealthy built-environments to healthier ones, policymakers will need to prioritize the demands of public health against the backdrop of influential and longstanding special interests

A broader approach to designing environments that promote healthy behaviors must also account for additional barriers that individuals with lower socioeconomic status commonly face. The government cannot rely solely on the private sector to drive these changes since those who stand to benefit most may be unemployed or not working for progressive employers with the resources to launch effective health campaigns. Thus, focusing on government food programs and community-based approaches that effect a lower-income demographic is critical (e.g., sidewalk coverage and safe streets, eliminating food deserts, maintaining outdoor parks). In addition to these more specific interventions, the clear connection between environment and health should only bolster the case for expanding social service programs more broadly. Realizing and addressing the fact that so many of the outcomes that lie inside of health care are rooted in factors that lie outside of health care is thus critical to improving health.


If we want to avert a public health crisis at the hands of chronic lifestyle-driven diseases, we need not only focus on changing individual behaviors, but also on changing the environments that give rise to those behaviors. Governments and employers must recognize the overwhelming influence of context on action, and take advantage of their unique position to intentionally shape environments that promote healthy behaviors.
  1. Kahneman, D. Thinking fast and slow. New York: Farrar, Straus, and Giroux. (2011).
  2. For more on Behavioral Science, see the Behavioral Science and Policy Association and its forthcoming journal Behavioral Science and Policy.
  3. Read, D., & Van Leeuwen, B. Predicting hunger: the effects of appetite and delay on choice. Organizational Behavior and Human Decision Processes. 1998; 76 (2), 189-205.
  4. Van Ittersum, K., & Wansink, B. Plate size and color suggestibility: the delboeuf illusion’s bias on serving and eating behavior. Journal of Consumer Research. 2012; 39 (2), 215-228.
  5. Johnson, E. J., & Goldstein, D. Do defaults save lives? Science. 2003; 302, 1338-1339.
  6. Thaler, R. H., & Sunstein, C. R. Nudge: Improving decisions about health, wealth, and happiness. New York: Penguin Books. (2009).
  7. Turner, L., & Chaloukpa, F. J. Perceived reactions of elementary school students to changes in school lunches after implementation of the United States Department of Agriculture’s new meals standards: minimal backlash, but rural and socioeconomic disparities exist. Childhood Obesity. 2014; 10 (4), 349-356.
  8. Rao, M., Afshin, A., Singh, G., & Mozaffarian D. Do healthier foods and diet patterns cost more than less healthy options? A systematic review and meta-analysis. BMJ Open. 2013; 3 (12). doi:10.1136/bmjopen-2013-004277.
  9. Roberto, C. A., & Khandpur, N. Improving the design of nutrition labels to promote healthier food choices and reasonable portion sizes. International Journal of Obesity. 2014; 38, 525-533.
  10. Nuval.com. Accessed August 12, 2014.
  11. Nuval.com: Trading Up Tips. Accessed August 28, 2014.
  12. Sonnenberg, L., Gelsomin, E., Levy, E. D., Riis, D., Barraclough, S., & Thorndike, A., N. A traffic light food labeling intervention increases consumer awareness of health and healthy choices at the point-of-purchase. Preventative Medicine. 2013; 57 (4), 253-257.
  13. Freeland, A. L., Banerjee, S. N., Dannenberg, A., L & Wendel, A. M. Walking associated with public transit: moving toward increased physical activity in the United States. American Journal of Public Health. 2013; 103 (3), 536-542.
  14. Kuang, C. 6 ways Google hacks its cafeterias so Googlers eat healthier. Fast Company. April 2012; (164).
  15. Wacther, Luke. Personal Interview on July 20, 2014.
  16. Walking meetings could make work healthier, happier. CBS News. 07, May 2014.
  17. Nixon, R. Nutrition Group Lobbies Against Healthier School Meals it Sought, Citing Cost. New York Times. 01, July 2014.

The “pay less, get more” era of health care

Excellent summary of current US funding situation…

http://www.vox.com/2014/9/10/6121631/the-pay-less-get-more-era-of-health-care

The “pay less, get more” era of health care

Health care spending has, for decades, followed a consistent pattern. America pays more and more for health care — and gets less and less.

Between 1990 and 2012, the insured rate in the United States fell two percentage points, from 86.6 to 84.6 percent. If the insured rate had just held steady, six million more people would have been covered in 2012.

While we were covering less people, we kept spending more on health care. National health spending, over that time period, rose from 12 percent of the economy in 1990 to 17.2 percent in 2012. Adjusted for inflation, health-care spending rose from $1.1 trillion to $2.8 trillion over those 22 years.

health spend more get less

That’s been the typical story of American health care: a lousy deal where we get less and spend more.

But there’s a growing body of evidence that this trend is changing; that we’re starting to get a shockingly better deal in a way that has giant consequences for how America spends money. Call it the “get more, pay less” era.

The “get more, pay less” era of health care spending

There are two big trends that, taken together, suggest we may be fundamentally different era of health care spending.

The first is lots more people getting coverage. This is mostly Obamacare: the health care law is expected to expand insurance coverage to 26 million people by 2024. In 2014 alone, most estimates suggest about 5 million people have gained health coverage through the law. The recovering economy is likely playing a supporting role, too, with those gaining jobs also gaining access to employer-sponsored coverage.

The second big trend is in what we spend: actuaries expect that health care costs will grow slower over the next decade than they did in the 1990s and 2000s.

More specifically: health care costs grew, on average, 2 percent faster than the economy between 1990 and 2008. Health spending took over an ever-growing share of the economy. Workers barely got raises; skyrocketing premiums ate up most of their additional wages.

The next decade is now expected to be different. Actuaries at the Center for Medicare and Medicaid Services project health care costs to grow 1 percent faster than the rest of the economy between 2013 and 2023.

“We are seeing historic moderation in costs now over a considerable period of time,” Kaiser Family Foundation president Drew Altman says. HIs group recently released data showing slow growth of employer-sponsored coverage. “It’s absolutely true we’re seeing that and any expert will tell you that.”

This is startling: over the next decade, forecasters think our health spending will grow at a slower rate, even as millions and millions of Americans gain access to health insurance. After two decades of spending more and getting less, we’re entering an era of spending less and getting more. It’s bizarro health spending world.

There are signs of this throughout the health care system

One thing that’s so striking about the “get more, pay less” trend is that it isn’t limited to one particular insurance plan or program. It’s starting to crop up in lots of new health care data, suggesting this change has become pervasive in the health care industry.

Start with private health insurance: the Kaiser Family Foundation recently published research finding the average price of Obamacare’s benchmark will fall slightly in 2015. As my colleague Ezra Klein wrote recently, this just about unprecedented. “Falling is not a word that people associate with health-insurance premiums,” he writes .”They tend to rise as regularly as the morning sun.”

Lower premiums make health care dollars stretch further: Obamacare shoppers will be able to buy the coverage they had last year at a slightly lower price. That’s a big deal when you’re talking about paying for a health insurance program meant to cover tens of millions of Americans.

Increasingly narrow health insurance networks are another sign of “get more, pay less” era. Over the past few years — and especially under Obamacare —insurers have gravitated towards cheaper premium plans to offer access to a smaller number of doctors.

narrow network graph

These plans’ more limited doctor choice can have a big impact on spending. Research from economists Jon Gruber and Robin McKnight found that, in one example, switching enrollees to these plans cut overall spending by one third. And while patients had access to fewer hospitals, the hospitals that were in network were of equally good quality.

Then there’s the Medicare side of the equation, where there has been a unprecedented decline in per person spending. Margot Sanger-Katz at the Upshot has had two fantastic posts on Medicare’s cost slowdown. One of them points out the fact that, since 2010, per patient spending has grown slower than the rest of the economy. You can see that in this graph, which charts “excess cost growth” in Medicare (health wonk speak for cost growth above and beyond inflation). For the past few years, excess growth has been replaced by slower-than-the-economy growth.

medicare excess cost growth

(The New York Times)

As Sanger-Katz points out, there are two trends at play in Medicare. One is that younger baby boomers keep aging onto the program. They’re younger than Medicare’s really old patients, and typically less expensive to care for. That drives down per person spending for the whole population.

But there’s something else going on that looks to be a more permanent trend: Medicare patients are using less expensive care. They go to the doctor more, and the hospital less. You can see this in new data from the Medicare Trustees’ report, which shows per person spending on Medicare Part A (the program that covers inpatient care) falling over the past few years.

medicare

Because of this shift away from hospital care, Medicare Part A now spends less money to cover more people. It paid $266.8 billion covering 50.3 million people in 2012. In 2013, the the same program spent $266.2 billion to cover 51.9 million people.

Will “pay less, get more” health care stick?

We have had periods of relatively slow health care growth before. In the mid-1990s, for example, there was a stretch of time when health spending grew at the same rate as the rest of the economy. You can see that in this graph.

health spending growth

Most health economists attribute that to the rise of health maintenance organizations, or HMOs, that sharply limited access to specialists. Patients, unsurprisingly, didn’t like those limitations and there was a backlash. HMOs declined and health spending rose again.

But some health economists say that this time feels different. For one, the changes are happening in private insurance and Medicare, suggesting there’s no single — and thus easily reversible — force driving the change.

And while there are more patients in narrow network products, something akin to HMOs, consumers are often choosing to be there. These are shoppers on the Obamacare exchanges who have decided to make a trade off: they’re take lower premiums for less choice of doctor.

“In the 1990s, people were essentially stuck in HMOs,” M.I.T economist Gruber says. “This time, people are given an option and make a choice. That’s why I’m more confident this slower growth will stick.”

Medicare actuaries are not fortune tellers; they do not have a crystal ball that conjures up the future of health care with perfect clarity. But at least at this particular moment, there are lots of signs cropping up to suggest something very important in health care is changing, and it’s for the better.

CARD 3 OF 15LAUNCH CARDS

How does American health-care spending compare to other countries?

The United States has higher per-person health-care spending than all other industrialized nations. The most recent international data from the OECD estimates that the United States puts 17.7 percent of its economy towards health care (slightly higher than CMS’s estimate of 17.2 percent). The OECD average is 9.3 percent.

Health_care_oecd

Much of the difference between health care spending abroad and in the United States has to do with prices. Americans don’t actually go to the doctor a lot more than people in other countries. But when we do, our medical care costs more. Specific services, like MRIs and knee replacements, have significantly higher price tags when delivered in the United States than elsewhere.