Category Archives: policy

On bureaucracies

The American economist William A. Niskanen considered the organisation of bureaucracies and proposed a budget maximising model now influential in public choice theory. It stated that rational bureaucrats will “always and everywhere seek to increase their budgets in order to increase their own power.”

An unfettered bureaucracy was predicted to grow to twice the size of a comparable firm that faces market discipline, incurring twice the cost.

http://theconversation.com/reform-australian-universities-by-cutting-their-bureaucracies-12781

Reform Australian universities by cutting their bureaucracies

Australian universities need to trim down their bureaucracies. University image from www.shutterstock.com

Universities drive a knowledge economy, generate new ideas and teach people how to think critically. Anything other than strong investment in them will likely harm Australia.

But as Australian politicians are preparing to reform the university sector, there is an opportunity to take a closer look at the large and powerful university bureaucracy.

Adam Smith argued it would be preferable for students to directly pay academics for their tuition, rather than involve university bureaucrats. In earlier times, Oxford dons received all tuition revenue from their students and it’s been suggested that they paid between 15% and 20% for their rooms and administration. Subsequent central collection of tuition fees removed incentives for teachers to teach and led to the rise of the university bureaucracy.

Today, the bureaucracy is very large in Australian universities and only one third of university spending is allocated to academic salaries.


The money (in billions) spent by the top ten Australian research universities from 2003 to 2010 (taken from published financial statements).Authors
Click to enlarge


Across all the universities in Australia, the average proportion of full-time non-academic staff is 55%. This figure is relatively consistent over time and by university grouping (see graph below).

Australia is not alone as data for the United Kingdom shows a similar staffing profile with 48% classed as academics. A recent analysis of US universities’ spending argues:

Boards of trustees and presidents need to put their collective foot down on the growth of support and administrative costs. Those costs have grown faster than the cost of instruction across most campuses. In no other industry would overhead costs be allowed to grow at this rate – executives would lose their jobs.

We know universities employ more non-academics than academics. But, of course, “non-academic” is a heterogeneous grouping. Many of those classified as “non-academic” directly produce academic outputs, but this rubs both ways with academics often required to produce bureaucratic outputs.

An explanation for this strange spending allocation is that academics desire a large bureaucracy to support their research efforts and for coping with external regulatory requirements such as the Excellence in Research for Australia (ERA) initiative, theAustralian Qualifications Framework (AQF) and the Tertiary Education Quality and Standards Agency (TEQSA).


Staffing profile (% of total FTE classed as academic) of Australian universities 2001-2010, overall and by university groupings/ alliances.Authors


Another explanation is that university bureaucracies enjoy being big and engage in many non-academic transactions to perpetuate their large budget and influence.

The theory to support the latter view came from Cyril Northcote Parkinson, a naval historian who studied the workings of the British civil service. While not an economist, he had great insight into bureaucracy and suggested:

There need be little or no relationship between the work to be done and the size of the staff to which it may be assigned.

Parkinson’s Law rests on two ideas: an official wants to multiply subordinates, not rivals; and, officials make work for each other. Inefficient bureaucracy is likely not restricted to universities but pervades government and non-government organisations who escape traditional market forces.

Using Admiralty Statistics for the period between 1934 and 1955, Parkinson calculated a mean annual growth rate of spending on bureaucrats to be 5.9%. The top ten Australian research universities between 2003 and 2010 report mean annual growth in spending on non-academic salary costs of 8.8%. After adjusting for inflation the annual growth rate is 5.9%.

The American economist William A. Niskanen considered the organisation of bureaucracies and proposed a budget maximising model now influential in public choice theory. It stated that rational bureaucrats will “always and everywhere seek to increase their budgets in order to increase their own power.”

An unfettered bureaucracy was predicted to grow to twice the size of a comparable firm that faces market discipline, incurring twice the cost. Some insight and anecdotal evidence to support this comes from a recent analysis of the paperwork required for doctoral students to progress from admission to graduation at an Australian university.

In that analysis, the two authors of this article (Clarke and Graves) found that 270 unique data items were requested on average 2.27 times for 13 different forms. This implies the bureaucracy was operating at more than twice the size it needs to. The university we studied has since slimmed down the process.

Further costs from a large bureaucracy arise because academics are expected to participate in activities initiated by the bureaucracy. These tend to generate low or zero academic output. Some academics also adopt the behaviour of bureaucrats and stop or dramatically scale back their academic work.

The irony is that those in leadership positions, such as heads of departments, are most vulnerable, yet they must have been academically successful to achieve their position.

Evidence of this can be seen from the publication statistics of the professors who are heads of schools among nine of the top ten Australian research universities. Between 2006 and 2011, these senior academics published an average of 1.22 papers per year per person as first author.

This level of output would not be acceptable for an active health researcher at a professor, associate professor or even lecturer level.

The nine heads of school are likely tied up with administrative tasks, and hence their potential academic outputs are lost to signing forms, attending meetings and pushing bits of paper round their university.

If spending on the costs of employing non-academics could be reduced by 50% in line with a Niskanen level of over-supply, universities could employ additional academic staff. A further boost to productivity could be expected as old and new staff benefit from a decrease in the amount of time they must dedicate to bureaucratic transactions.

If all Australian universities adopted the staffing profile of the “Group of 8” institutions, which have the highest percentage of academics (at 51.6%), there would have been up to nearly 6,500 extra academics in 2010.

While no economist would question the need for some administration, there needs to be a focus on incentives to ensure efficient operation. It’s possible to run a tight ship in academic research as shown by Alan Trounson, president of the California Institute for Regenerative Medicine (CIRM).

In 2009, Trounson pledged to spend less than 6% of revenues on administration costs, a figure that is better than most firms competing in markets. So far, this commitment has been met.

It’s clear then that finding solutions to problems in modern Australian universities calls for a better understanding of economics and a reduction in bureaucracy.
Dream Food Label

Nice sounding food labelling system. As Bittman suggests, at least a decade away…


http://www.nytimes.com/2012/10/14/opinion/sunday/bittman-my-dream-food-label.html

My Dream Food Label
By 

Published: October 13, 2012

WHAT would an ideal food label look like? By “ideal,” I mean from the perspective of consumers, not marketers.

Multimedia
The Proposed Nutrition Label: A Quick Read, Out Front
 Right now, the labels required on food give us loads of information, much of it useful. What they don’t do is tell us whether something is really beneficial, in every sense of the word. With a different set of criteria and some clear graphics, food packages could tell us much more.

Even the simplest information — a red, yellow or green “traffic light,” for example — would encourage consumers to make healthier choices. That might help counter obesity, a problem all but the most cynical agree is closely related to the consumption of junk food.

Of course, labeling changes like this would bring cries of hysteria from the food producers who argue that all foods are fine, although some should be eaten in moderation. To them, a red traffic-light symbol on chips and soda might as well be a skull and crossbones. But traffic lights could work: indeed, in one study, sales of red-lighted soda fell by 16.5 percentin three months.

A mandate to improve compulsory food labels is unlikely any time soon. Front-of-package labeling is sacred to big food companies, a marketing tool of the highest order, a way to encourage purchasing decisions based not on the truth but on what manufacturers would have consumers believe.

So think of the creation of a new food label as an exercise. Even if some might call it a fantasy, the world is moving this way. Traffic-light labeling came close to passing in Britain, and our own Institute of Medicine is proposing something similar. The basic question is, how might we augment current food labeling (which, in its arcane detail, serves many uses, including alerting allergic people to every specific ingredient) to best serve not only consumers but all contributors to the food cycle?

As desirable as the traffic light might be, it’s merely a first step toward allowing consumers to make truly enlightened decisions about foods. Choices based on dietary guidelines are all well and good — our health is certainly an important consideration — but they don’t go nearly far enough. We need to consider the well-being of the earth (and all that that means, like climate, and soil, water and air quality), the people who grow and prepare our food, the animals we eat, the overall wholesomeness of the food — what you might call its “foodness” (once the word “natural” might have served, but that’s been completely co-opted), as opposed to its fakeness. (“Foodness” is a tricky, perhaps even silly word, but it expresses what it should. Think about the spectrum from fruit to Froot Loops or from chicken to Chicken McNuggets and you understand it.) These are considerations that even the organic label fails to take into account.

Beyond honest and accurate nutrition and ingredient information, it would serve us well to know at a glance whether food contains trans fats; residues from hormones, antibiotics,pesticides or other chemicals; genetically modified ingredients; or indeed any ingredients not naturally occurring in the food. It would also be nice to be able to quickly discern how the production of the food affected the welfare of the workers and the animals involved and the environment. Even better, it could tell us about its carbon footprint and its origins.

A little of this is covered by the label required for organic food. Some information is voluntarily being provided by producers — though they’re most often small ones — and retailers like Whole Foods. But only when this kind of information is required will consumers be able to express preferences for health, sustainability and fairness through our buying patterns.

Still, one can hardly propose covering the front of packages with 500-word treatises about the product’s provenance. On the other hand, allowing junk food to be marketed as healthy is unacceptable, or at least would be in a society that valued the rights of consumers over those of the corporation. (The “low-fat” claim is the most egregious — plenty of high-calorie, nutritionally worthless foods are in fact fat-free — but it’s not alone.)

All of this may sound like it’s asking a lot from a label, but creating a model wasn’t that difficult. Over the last few months, I’ve worked with Werner Design Werks of St. Paul to devise a food label that, at perhaps little more than a glance (certainly in less than 10 seconds), can tell a story about three key elements of any packaged food and can provide an overall traffic-light-style recommendation or warning.

How such a labeling system could be improved, which agency would administer it (it’s now the domain of the F.D.A.), which producers would be required to use it, whether foods should carry quick-response codes that let your phone read the package and link to a Web site — all of those questions can be debated freely. Suffice it to say we went through numerous iterations to arrive at the label we are proposing. We put it out here not as an end but as a beginning.

Every packaged food label would feature a color-coded bar with a 15-point scale so that almost instantly the consumer could determine whether the product’s overall rating fell between 11 and 15 (green), 6 and 10 (yellow) or 0 and 5 (red). This alone could be enough for a fair snap decision. (We’ve also got a box to indicate the presence or absence of G.M.O.’s.)

We arrive at the score by rating three key factors, each of which comprises numerous subfactors. The first is the obvious “Nutrition,” about which little needs to be said. High sugar, trans fats, the presence of micronutrients and fiber, and so on would all be taken into account. Thus soda would rate a zero and frozen broccoli might rate a five. (It’s hard to imagine labeling fresh vegetables.)

The second is “Foodness.” This assesses just how close the product is to real food. White bread made with bleached flour, yeast conditioners and preservatives would get a zero or one; so would soda; a candy bar high in sugar but made with real ingredients would presumably score low on nutrition but could get a higher score on “foodness”; here, frozen broccoli would rate a four.

The third is the broadest (and trickiest); we’re calling it “Welfare.” This would include the treatment of workers, animals and the earth. Are workers treated like animals? Are animals produced like widgets? Is environmental damage significant? If the answer to those three questions is “yes” — as it might be, for example, with industrially produced chickens — then the score would be zero, or close to it. If the labor force is treated fairly and animals well, and waste is insignificant or recycled, the score would be higher.

These are not simple calculations, but neither can one honestly say that they’re impossible to perform. It may well be that there are wiser ways to sort through this information and get it across. The main point here is: let’s get started.

<nyt_correction_bottom>

<nyt_update_bottom>

A version of this op-ed appeared in print on October 14, 2012, on page SR6 of the New York edition with the headline: My Dream Food Label.


Published: October 13, 2012

The Proposed Nutrition Label: A Quick Read, Out Front

MAMA C’S ORGANIC TOMATO SAUCE This contains organic tomatoes, extra virgin olive oil, and fresh herbs; it’s even refrigerated, so it contains no preservatives.


Since Mama C runs an organic operation with a full-time labor force receiving benefits, the score here is superhigh all around, and the label is green.

0-5

6-10

11-15 points

CHOCOLATE FROSTED SUPER KRISPY KRUNCHIES Fifty percent sugar; almost all nutrients come from additives. But it does contain 10 percent of the daily allowance of fiber.


It’s barely recognizable as food in any near-natural form, and it’s made from hyper-processed commodity crops. However, workers in the plant are full time and receive benefits (and no animals are harmed), so a couple of points there (environmentally, however, the welfare is negative, so these points are mitigated): 2. Thus, red.


With US food labeling, the times, they are a changing…

Impressive changes in US food labeling.

Introducing the label, Mrs. Obama said, “Our guiding principle here is very simple: that you as a parent and a consumer should be able to walk into your local grocery store, pick up an item off the shelf, and be able to tell whether it’s good for your family.”

http://www.nytimes.com/2014/03/05/opinion/bittman-some-progress-on-eating-and-health.html

The Opinion Pages|CONTRIBUTING OP-ED WRITER

Some Progress on Eating and Health

For those concerned about eating and health, the glass was more than half full last week; some activists were actually exuberant. First, there wasevidence that obesity rates among pre-school children had fallen significantly. Then Michelle Obama announced plans to further reduce junk food marketing in public schools. Finally, she unveiled the Food and Drug Administration’s proposed revision of the nutrition label that appears on (literally, incredibly) something like 700,000 packaged foods (many of which only pretend to be foods); the new label will include a line for “added sugars” and makes other important changes, too.

If the 43 percent plunge in obesity in young children holds true, it’s fantastic news, a tribute to the improved Special Supplemental Nutrition Program for Women, Infants and Children (WIC), which encourages the consumption of fruits and vegetables; to improved nutrition guidelines; to a slight reduction in the marketing of junk to children; and probably to the encouragement of breast-feeding. Practically everyone in this country who speaks English or Spanish has heard or read the message that junk food is bad for you, and that patterns set in childhood mostly determine eating habits for a lifetime.

None of this happened by accident, and the lesson is that policy works.

The further limitations on marketing junk are more complicated. Essentially, producers won’t be able to promote what they already can’t sell (per new Department of Agriculture regulations), meaning that vending machines or scoreboards cannot encourage the consumption of sugar-sweetened beverages. (Promotion of increasingly beleaguered diet sodas would be allowed.)

Mrs. Obama’s tendency to see the reformulation of packaged foods as an important goal is on display here: Snacks sold in schools (both in vending machines and out) will have to meet one of four requirements, like containing at least 50 percent whole grain or a quarter-cup of fruits or vegetables.

These proposed rules are better than nothing but filled with loopholes. Manufacturers will quickly figure out how to meet the new standards, and the improvements, though not insignificant, will not go far in teaching kids that the best snack is an apple or a handful of nuts. (One way to really clobber junk food would be to prevent companies from taking tax deductions on the marketing of unhealthy foods, a move that’s in a bill sponsored by Congresswoman Rosa DeLauro of Connecticut.)

Still. It beats calling ketchup a vegetable.

The label change is huge. Yes: It could be huge-er. Yes: It’s long overdue. Yes: It may be fought by industry and won’t be in place for a long time. And yes: The real key is to be eating whole foods that don’t need to be labeled.

But by including “added sugars” on the label, the F.D.A. is siding with those who recognize that science shows that added sugars are dangerous. “This is an acknowledgment by the agency that sugar is a big problem,” says the former F.D.A. commissioner David Kessler, who presided over the development of the last label change, 20 years ago. “It will allow the next generation to grow up with far more awareness.”

Big Food has long maintained that it doesn’t matter where sugar or indeed calories come from — that they’re all the same. But “added sugars” declares the industry’s strategy of pumping up the volume on “palatability,” making ketchup, yogurt and granola bars, for example, as sweet and high-calorie as jam, ice cream and Snickers. Added sugar turns sparkling water into soda and food-like objects into candy. Added sugar, if you can forgive the hyperbole, is the enemy. This is not to say you shouldn’t eat a granola bar, but if you know what’s in it you’re less likely to think of it as “health food.”

There are a couple of other significant changes, including more realistic “serving sizes” (a serving of ice cream will now be a more realistic cup instead of a half-cup, for example), the deletion of the “calories from fat” line, which recognizes that not all fats are “bad,” and some changes in daily recommended values for various nutrients.

Mrs. Obama, who is sometimes seen (by me among many others) as overly industry-friendly, was behind the push for these changes, or at least highly supportive of them. And she deserves credit: It’s a victory, and no one on the progressive side of this struggle should see it as otherwise.

The label is hardly messianic. In fact, the F.D.A. tacitly acknowledges this by offering an alternative, stronger label, which approaches the kind of “traffic light” labeling I’ve advocated for, and which there’s evidence to support. The alternative has four sections, including “Avoid Too Much” and “Get Enough”; the first includes added sugars and trans fat, for example, and the second, fiber and vitamin D.

Michael Taylor, the F.D.A.’s deputy commissioner for foods and veterinary medicine — and the guy who supervised the new label’s development — told me that the alternative label is essentially a way to further “stimulate comments.” It may be that it’s also a demonstration of the agency’s will, designed to show industry how threatening things could get so Big Food will swallow the primary label without much complaint.

Although the ultimate decision is the F.D.A.’s, the Grocery Manufacturers’ Association statement last week said in part, “It is critical that any changes are based on the most current and reliable science.” These are, and marketers are going to have a tough time claiming otherwise. In other words, we’re going to see some form of new and stronger label, period.

Introducing the label, Mrs. Obama said, “Our guiding principle here is very simple: that you as a parent and a consumer should be able to walk into your local grocery store, pick up an item off the shelf, and be able to tell whether it’s good for your family.”

This label moves in that direction, but it could be much more powerful. Kessler would like to see a pie chart on the front of the package: “That would help people know what’s real food and what’s not.” Michael Pollan also suggests front-of-the-box labeling: “I think the U.K. has the right idea withtheir stoplight panel on the front of packages; only a small percentage of shoppers get to the nutritional panel on the back.” And the N.Y.U. nutrition professor Marion Nestle (who called this label change “courageous”) says that “A recommended upper limit for added sugars would help put them in context; I’d like to see that set at 10 percent of calories or 50 grams (200 calories) in a 2,000-calorie diet.” (I wrote about my own dream label, which includes categories that probably won’t be considered for another 10 years — if ever — back in 2012.)

What else is wrong? The label covers a lot of food, but it has no effect on restaurant food, takeout, most prepared food sold in bulk (do you have any idea what’s in that fried chicken at the supermarket deli counter, for example?) or alcohol.

The Obama administration and the F.D.A. have made a couple of moves here that might be categorized as bold, but they could have done so three or four years ago; these are regulations that can be built upon, and do not require Congressional approval. But by the time they’re in effect it may be too late for this administration to take them to the next level.

In short, it’s not a case of too-little-too-late but one of “it could’ve been more and happened sooner.”

But that’s looking backward instead of forward. If we see a decline in obesity rates, more curbs on food marketing and greater transparency in packaged food, that’s progress. Let’s be thankful for it, then get back to work pushing for more.

A couple of terrific safety quality presentations


Rene Amalberti to a Geneva Quality Conference:

b13-rene-amalberti

http://www.isqua.org/docs/geneva-presentations/b13-rene-amalberti.pdf?sfvrsn=2


Some random, but 80 slides, often good

Clapper_ReliabilitySlides

http://net.acpe.org/interact/highReliability/References/powerpoints/Clapper_ReliabilitySlides.pdf

Big data in healthcare

A decent sweep through the available technologies and techniques with practical examples of their applications.

Big data in healthcare

Big data in healthcare

big data in healthcare industrySome healthcare practitioners smirk when you tell them that you used some alternative medication such as homeopathy or naturopathy to cure some illness. However, in the longer run it sometimes really is a much better solution, even if it takes longer, because it encourages and enables the body to fight the disease naturally, and in the process build up the necessary long term defence mechanisms. Likewise, some IT practitioners question it when you don’t use the “mainstream” technologies…  So, in this post, I cover the “alternative” big data technologies. I explore the different types of big data datatypes and the NoSQL databases that cater for them. I illustrate the types of applications and analyses that they are suitable for using healthcare examples.


Big data in healthcare

Healthcare organisations have become very interested in big data, no doubt fired on by the hype around Hadoop and the ongoing promises that big data really adds big value.

However, big data really means different things to different people. For example, for a clinical researcher it is unstructured text on a prescription, for a radiologist it is the image of an x-ray, for an insurer it may be the network of geographical coordinates of the hospitals they have agreements with, and for a doctor it may refer to the fine print on the schedule of some newly released drug. For the CMO of a large hospital group, it may even constitute the commentary that patients are tweeting or posting on Facebook about their experiences in the group’s various hospitals. So, big data is a very generic term for a wide variety of data, including unstructured text, audio, images, geospatial data and other complex data formats, which previously were not analysed or even processed.

There is no doubt about that big data can add value in the healthcare field. In fact, it can add a lot of value. Partially because of the different types of big data that is available in healthcare. However, for big data to contribute significant value, we need to be able to apply analytics to it in order to derive new and meaningful insights. And in order to apply those analytics, the big data must be in a processable and analysable format.

Hadoop

Enter yellow elephant, stage left. Hadoop, in particular, is touted as the ultimate big data storage platform, with very efficient parallelised processing through the MapReduce distributed “divide and conquer” programming model. However, in many cases, it is very cumbersome to try and store a particular healthcare dataset in Hadoop and try and get to analytical insights using MapReduce. So even though Hadoop is an efficient storage medium for very large data sets, it is not necessarily the most useful storage structure to use when applying complex analytical algorithms to healthcare data. Quick cameo appearance. Exit yellow elephant, stage right.

There are other “alternative” storage technologies available for big data as well – namely the so-called NoSQL (not only SQL) databases. These specialised databases each support a specialised data structure, and are used to store and analyse data that fits that particular data structure. For specific applications, these data structures are therefore more appropriate to store, process and extract insights from data that suit that storage structure.

Unstructured text

A very large portion of big data is unstructured text, and this definitely applies to healthcare too. Even audio eventually becomes transformed to unstructured text. The NoSQL document databases are very good for storing, processing and analysing documents consisting of unstructured text of varying complexity, typically contained in XML, JSON or even Microsoft Word or Adobe format files. Examples of the document databases are Apache CouchDB and MongoDb. The document databases are good for storing and analysing prescriptions, drug schedules, patient records, and the contracts written up between healthcare insurers and providers.

On textual data you perform lexical analytics such as word frequency distributions, co-occurrence (to find the number of occurrences of particular words in a sentence, paragraph or even a document), find sentences or paragraphs with particular words within a given distance apart, and other text analytics operations such as link and association analysis. The overarching goal is, essentially, to turn unstructured text into structured data, by applying natural language processing (NLP) and analytical methods.

For example, if a co-occurrence analysis found that BRCA1 and breast cancer regularly occurred in the same sentence, it might assume a relationship between breast cancer and the BRCA1 gene. Nowadays co-occurrence in text is often used as a simple baseline when evaluating more sophisticated systems.

Rule-based analyses make use of some a priori information, such as language structure, language rules, specific knowledge about how biologically relevant facts are stated in the biomedical literature, the kinds of relationships or variant forms that they can have with one another, or subsets or combinations of these. Of course the accuracy of a rule-based system depends on the quality of the rules that it operates on.

Statistical or machine-learning–based systems operate by building classifications, from labelling part of speech to choosing syntactic parse trees to classifying full sentences or documents. These are very useful to turn unstructured text into an analysable dataset. However, these systems normally require a substantial amount of already labelled training data. This is often time-consuming to create or expensive to acquire.

However, it’s important to keep in mind that much of the textual data requires disambiguation before you can process, make sense of, and apply analytics to it. The existence of ambiguity, such as multiple relationships between language and meanings or categories makes it very difficult to accurately interpret and analyse textual data. Acronym / slang / shorthand resolution, interpretation, standardisation, homographic resolution, taxonomy ontologies, textual proximity, cluster analysis and various other inferences and translations all form part of textual disambiguation. Establishing and capturing context is also crucial for unstructured text analytics – the same text can have radically different meanings and interpretations, depending on the context where it is used.

As an example of the ambiguities found in healthcare, “fat” is the official symbol of Entrez Gene entry 2195 and an alternate symbol for Entrez Gene entry 948. The distinction is not trivial – the first is associated with tumour suppression and with bipolar disorder, while the second is associated with insulin resistance and quite a few other unrelated phenotypes. If you get the interpretation wrong, you can miss or erroneously extract the wrong information.

Graph structures

An interesting class of big data is graph structures, where entities are related to each other in complex relationships like trees, networks or graphs. This type of data is typically neither large, nor unstructured, but graph structures of undetermined depth are very complex to store in relational or key-value pair structures, and even more complex to process using standard SQL. For this reason this type of data can be stored in a graph-oriented NoSQL database such as Neo4J, InfoGrid, InfiniteGraph, uRiKa, OrientDB or FlockDB.

Examples of graph structures include the networks of people that know each other, as you find on LinkedIn or Facebook. In healthcare a similar example is the network of providers linked to a group of practices or a hospital group. Referral patterns can be analysed to determine how specific doctors and hospitals team together to deliver improved healthcare outcomes. Graph-based analyses of referral patterns can also point out fraudulent behaviour, such as whether a particular doctor is a conservative or a liberal prescriber, and whether he refers patients to a hospital that charges more than double than the one just across the street.

Another useful graph-based analysis is the spread of a highly contagious disease through groups of people who were in contact with each other. An infectious disease clinic, for instance, should strive to have higher infection caseloads across such a network, but with lower actual infection rates.

A more deep-dive application of graph-based analytics is to study network models of genetic inheritance.

Geospatial data

Like other graph-structured data, geospatial data itself is pretty structured – coordinates can simply be represented as pairs of coordinates. However, when analysing and optimising ambulance routes of different lengths, for example, the data is best stored and processed using a graph structures.

Geospatial analyses are also useful for hospital and practice location planning. For example, Epworth HealthCare group teamed up with geospatial group MapData Services to conduct an extensive analysis of demographic and medical services across Victoria. The analysis involved sourcing a range of data including Australian Bureau of Statistics figures around population growth and demographics, details of currently available health services, and the geographical distribution of particular types of conditions. The outcome was that the ideal location and services mix for a new $447m private teaching hospital should be in the much smaller city of Geelong, instead of in the much larger but services-rich city of Melbourne.

Sensor data

Sensor data often are also normally quite structured, with an aspect being measured, a measurement value and a unit of measure. The complexity comes in that for each patient or each blood sample test you often have a variable record structure with widely different aspects being measured and recorded. Some sources of sensor data also produce large volumes of data at high rates. Sensor data are often best stored in key-value databases, such as Riak, DynamoDB, Redis Voldemort, and sure, Hadoop.

Biosensors are now used to enable better and more efficient patient care across a wide range of healthcare operations, including telemedicine, telehealth, and mobile health. Typical analyses compare related sets of measurements for cause and effect, reaction predictions, antagonistic interactions, dependencies and correlations.

For example, biometric data, which includes data such as diet, sleep, weight, exercise, and blood sugar levels, can be collected from mobile apps and sensors. Outcome-oriented analytics applied to this biometric data, when combined with other healthcare data, can help patients with controllable conditions improve their health by providing them with insights on their behaviours that can lead to increases or decreases in the occurrences of diseases. Data-wise healthcare organisations can similarly use analytics to understand and measure wellness, apply patient and disease segmentation, and track health setbacks and improvements. Predictive analytics can be used to inform and drive multichannel patient interaction that can help shape lifestyle choices, and so avoid poor health and costly medical care.

Concluding remarks

Although there are merits in storing and processing complex big data, we need to ensure that the type of analytical processing possible on the big data sets lead to valuable enough new insights. The way in which the big data is structured often has an implication on the type of analytics that can be applied to it. Often, too, if the analytics are not properly applied to big data integrated with existing structured data, the results are not as meaningful and valuable as expected.

We need to be cognisant of the fact that there are many storage and analytics technologies available. We need to apply the correct storage structure that matches the data structure and thereby ensure that the correct analytics can be efficiently and correctly applied, which in turn will deliver new and valuable insights.

Reformulation and marketing restrictions to prevent childhood obesity


http://www.foodnavigator.com/Product-Categories/Sweeteners-intense-bulk-polyols/EU-eyes-reformulation-and-marketing-restrictions-to-cut-childhood-obesity/

EU eyes reformulation and marketing restrictions to cut childhood obesity

By Caroline Scott-Thomas+

03-Mar-2014

The plan includes tougher limits on all marketing to children - not just television advertising

The plan includes tougher limits on all marketing to children – not just television advertising

Restricting marketing to children and continuing to cut salt, fats and added sugar in processed foods are among initiatives put forward in a plan to tackle childhood obesity, agreed by EU member states in Greece last week.

The action plan was agreed by the High Level Group on Nutrition and Physical Activity at a conference in Athens, and includes a range of voluntary initiatives intended to promote healthy environments and balanced diets, encourage physical activity, restrict advertising to children, and support ongoing efforts to slash levels of salt, fats and added sugar.

Childhood obesity is on the rise in Europe, the European Commission said, adding that about one in three children aged six to nine was overweight or obese in the region in 2010 versus one in four children in 2008. It said member states spent an estimated 7% of their healthcare budgets on treating weight-related problems.

The new strategy includes encouraging industry to make commitments in areas such as marketing, food reformulation, food distribution, catering and physical activity, with a specific focus on children, young people and the most deprived.

Referring to marketing restrictions in particular, it said limits on advertising to children should extend beyond television advertising to include all marketing, “including in-store environments, promotional actions, internet presence and social media activities”.

Taxation, subsidies and pricing

The plan also refers to making “the healthy option the easier option” – a strategy that could include taxation and subsidies for particular foods, or encouraging manufacturers to price reformulated foods at a lower level than standard versions.

Proposals included “encouraging reformulation of less healthy food options and taking nutritional objectives into consideration when defining taxation, subsidies or social support policies”.

In response to the plan, trade body FoodDrinkEurope said it hoped to continue a partnership approach to tackling childhood obesity in Europe.

“European food and drink manufacturers reaffirm their commitment to fight childhood obesity by means of ongoing and possibly new actions and initiatives targeted at children and parents through the established platforms for action at European and national level,” it said in a statement.

In defense of sugar

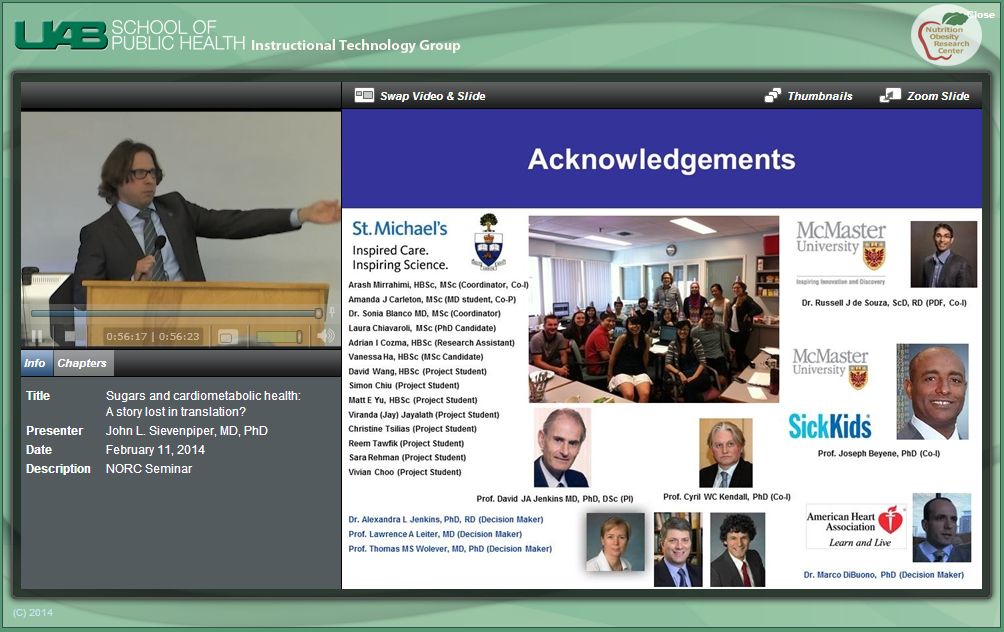
Interesting, detailed, slick presentation on the biochemistry and epidemiology of fructose on health

He discloses significant industry engagements (coca cola, dr pepper etc.)

Does present the view (shared by Katz) that it shouldn’t be about single nutrients, but diet and activity overall.

This seems to be industry-backed smoke to confuse the discussion.

http://media.soph.uab.edu/PresenterPlus/norc-sievenpiper-20140214/main.htm#

Title: Sugars and cardiometabolic health: A story lost in translation?
Presenter: John L. Sievenpiper, MD, PhD
Date: February 11, 2014
Description: NORC Seminar
SugarsOK

McAuley on health funding

A measured piece mainly having a crack at PHI.

https://newmatilda.com/2014/02/24/real-problems-our-health-system

Three Ways To Fund Our Health System

By Ian McAuley
The argument over $6 GP co-payments is little more than a distraction from the real task – untangling our incoherent system of health funding, writes Ian McAuley

Health Minister Peter Dutton is on the right track when he says he wants “to start a national conversation about modernising and strengthening Medicare”.

Our health arrangements serve us well, but as John Dwyer, Emeritus Professor of Medicine at UNSW, pointed out in an ABC interview last week, there are inefficiencies to be addressed. There are what economists call technical inefficiencies — too many bureaucrats in overlapping state and federal jurisdictions and in private insurance firms, poor use of information technology, rigid workforce demarcations and a lack of integration between different care providers. That’s just to name a few!

More seriously there are what economists call allocative inefficiencies — in particular high attention to treating illness contrasting with neglect of public health measures which could prevent illness.

These problems won’t be solved by half-baked ideas such as a $6 co-payment for GP services, a proposal which, in terms of transaction costs alone, is stupid, and which, if it could have any effect in reducing demand, would have its greatest impact on those for whom $6 is a burden. In fact if, as former Coalition policy advisor Terry Barnes suggests, if the $6 were to be covered by private insurance, there would be a huge increase in both private and public costs of health care.

Unfortunately the $6 proposal has commanded attention. It’s as if it has been put out as bait to draw attention away from other possible ideas of the Coalition Government, such as an extension of private insurance — which would do much more damage to health care affordability than a small co-payment.

If that is the Government’s strategy, Medicare’s defenders have taken the bait, digging into hard positions to defend the status quo, conveniently ignoring the fact that there are already significant co-payments in health care (such as the $37 payment for prescription pharmaceuticals), and ignoring the fact that all comparable countries, including those with much more socially inclusive systems such as Sweden, have co-payments before public insurance picks up the tab.

The Labor Party, rather than articulating any coherent principles on health funding, has opportunistically joined the chorus criticising the $6 co-payment.

A national conversation should start with an honest definition of the problem. It is not about an “unsustainable” health budget. Even if we deal with inefficiencies, it is to be expected that as our population ages, and as therapies become available, we will spend more on health care, and whether we spend it from our own pockets or from our taxes is a secondary issue — we will still pay for it. After all, we are spending more on eating out, but we don’t construe that as a “problem”.

Language counts. Some refer to public spending on health care as “social” spending, as if it is in a different category to spending on “real” government services such as roads and defence, and it has been caught up in the language of “entitlement”. As IMF Managing Director Christine Lagarde said on ABC’s Q&A last week:

“Investing in health, investing in education, making sure there are equal opportunities for all, is something where public money is needed … it is not a question of entitlement.”

A national conversation takes time and good faith. A government can lead the process if it helps people extract themselves from hard “positions” and articulate their interests. People need to break from assumptions, such as the idea that the present division of state and federal arrangements will stay, that pharmacies are necessarily separate from GP practices, that co-payments necessarily involve cash upfront (perhaps they could be liabilities to Centrelink), or that without private insurance private hospitals will not survive.

On funding, the basic question to put to the community is the extent to which we want to share our health care costs with one another. Do we want comprehensive sharing, funded through our taxes, or are we willing to pay some more from our own pockets — with protection, of course, for those for whom such payments would be too burdensome?

That question has never been put to the Australian community. Dutton is right — we need a national conversation.

It is possible that we do want a completely free system, and are willing to pay the higher taxes to support it. We may be willing to take risks in most parts of our lives, but because of the randomness of illness and accident we may want to pool our health care costs. We may place high value on social solidarity expressed through a universal free system of health care.

Alternatively, it is possible that, because we are wealthier than in previous times, we are happy to take more personal responsibility. Because health care is skewed towards high users, most Australians, most of the time, could easily pay for all their needs without any support from third parties such as Medicare or private insurers.

We may opt for a safety net to kick in only after we have made a reasonable contribution. Presumably that would be a much fairer and more sensible safety net than the present haphazard mess of free and charged services.

If, in response to community consultation, Australians opt for a high level of sharing and are willing to pay the required taxes — perhaps through a higher Medicare levy — politicians should respect that decision. They should not paternalistically override the community’s wishes by asserting we will be better off with lower taxes.

And they should avoid shifting the cost of sharing to private health insurance — a high-cost mechanism which does what the Australian Tax Office and Medicare do at much lower cost and with much greater equity. It makes no sense if, in an obsession with budgetary costs, we save $1.00 in official taxes only to have to pay $1.10 or $1.80 in “taxes” to BUPA, Medibank Private or NIB for the same or an inferior service.

If Australians opt for more personal responsibility, dealing with minor health care transactions as they do with other goods and services, then defenders of Medicare should respect that choice, and not complain when they see fees introduced for some previously free services. Rather they should ensure there are no barriers to those who are too poor or who lack liquidity to cover upfront payments. And governments should prohibit private insurers from covering those payments, for to do so would negate the discipline of markets (“moral hazard” in the quaint language of the insurance industry) and drive up costs for all users.

Those who remember the 1987 election will recall that the Liberal Party proposed a $250 uninsurable upfront payment — about $800 in today’s terms. It was sound policy, consistent with their platform of self-reliance, but it was poorly explained, and then as now private insurers had no interest in self-reliance — their business model is about subsidised corporate reliance.

In short, there are three ways to fund health care — on the “left” a completely tax-funded scheme, on the “right” a more market-based scheme with a high level of upfront payments, and in a space of its own private health insurance, which disingenuously combines all the worst aspects of socialism and capitalism, with none of their compensating merits.

Australian Medicare Fraud

The quoted estimate seems a bit under…

http://www.abc.net.au/news/2014-03-06/australians-defrauding-medicare-hundreds-of-thousands-of-dollars/5302584

Video: 

Australian Medicare fraud revealed in new figures, 1,116 tip-offs so far this financial year

By medical reporter Sophie Scott and Alison Branley

Updated Fri 7 Mar 2014, 1:23am AEDT

New figures show Medicare is being defrauded of hundreds of thousands of dollars each year.

Figures released to the ABC show the Federal Government has received more than 1,000 tip-offs of potential Medicare frauds to date this financial year.

It comes as debate continues over a proposal put to the Commission of Audit to charge a $6 co-payment for visits to the doctor, which would reduce costs to the health system.

The Department of Human Services says its hotline has received 1,116 Medicare-related tip-offs since July 1, 2013.

Officers have investigated 275 cases, which has translated into 34 cases submitted to the Commonwealth Department of Public Prosecutions and 12 convictions.

The value of those 12 cases adds up to an estimated $474,000, with fraudsters ripping off an average of almost $40,000 each.

Department figures suggest most of the frauds come from outside the doctor’s office.

Ten of the 12 prosecutions this year were members of the public. One involved a medical practice staff member and one a practice owner.

“The Department of Human Services takes all allegations of fraud seriously and seeks to investigate where sufficient information is provided to do so,” a spokeswoman said.

The annual review of doctors’ use of Medicare, the Professional Services Review, showed at least 19 doctors were required to repay more than $1 million between them in 2012-13.

One doctor billed Medicare for seeing more than 500 patients in a day, and more than 200 patients on several other days.

Other cases uncovered by the ABC include:

  • Former police officer Matthew James Bunning has been charged with 146 Medicare frauds between 2011 and 2013. Investigators allege the 46-year-old removed Medicare slips from rubbish bins behind Medicare offices around Melbourne to produce forged receipts and illegally claimed more than $98,000 from the Government.
  • In January last year Korean student Myung Ho Choi was sentenced in a NSW district court to five years in prison for a series of fraud and identity theft charges that included receiving at least five paper boxes filled with blank Medicare cards intended for use in identity fraud.
  • In August last year NSW man Bin Li was sentenced in district court to seven years in prison for charges that included possessing almost 400 blank cards, including high quality Medicare cards, and machines for embossing cards.

Nilay Patel, a former US-based certified specialist in healthcare compliance and law tutor at Swinburne University of Technology, says the fraud figures are the “tip of the iceberg”.

“There is a lot more that we do not know and that really comes from both camps from the patients and the medical service providers,” he said.

He says Australia is falling behind the United States at preventing, detecting and prosecuting healthcare frauds.

“The safeguards [in Australia] are quite inadequate, the detection is more reactive that proactive and whatever proactive mechanisms that are there I think they are woefully underdeveloped,” he said.

Relatively ‘smallish’ but unacceptable problem: Minister

Federal Government authorities say they do not think Medicare fraud is widespread.

Minister for Human Services Marise Payne says the number of Medicare frauds are low compared to the number of transactions.

“I think when you consider that we have 344 million Medicare transactions a year it is a relatively smallish [problem] but that doesn’t mean it’s acceptable,” she said.

“One person committing a fraud effectively against the Australian taxpayer is one person too many.”

Ms Payne says the department uses sophisticated data matching and analytics to pick up potential frauds as well as its tip-off hotline.

The merger of Medicare with Centrelink also allows the bureaucracies to better share information and leads.

“The work we have done in that area is paying dividends,” Ms Payne said.

“There is more to do. The use of analytical data and risk profiling is highly sophisticated in the Centrelink space and we want to make sure we achieve the same levels in the Medicare space.”

The Australian Federal Police says it does not routinely gather statistics on the number of fake or counterfeit Medicare cards.

However, a spokesman says detections of counterfeit Medicare cards are rare.

“Intelligence to date indicates that the majority of Medicare cards seized that are of sufficient quality, are used as a form of identity, not intentionally to defraud Medicare,” a spokesman said.

A Customs and Border Protection spokeswoman says blank or fraudulent Medicare cards are not controlled under the Customs regulations and it is unable to provide seizure statistics.

The federal Ombudsman says he has not conducted any review or investigations into Medicare but did contribute to a 2009 inquiry into compliance audits on benefits.

The Medicare complaints detailed in the Ombudsman’s annual report relate to customers disputing Medicare refunds, not frauds.

‘People are just looting the money’

Sydney man Tahir Abbas is sceptical about the Government’s claims that Medicare fraud is not widespread.

Mr Abbas detected at least 10 false bulk billing charges on his Medicare statement between November and January valued at almost $750.

He was not in the country when many of the charges were incurred.

The charges were from a western Sydney optometrist who told the ABC they were unable to explain the discrepancies.

They said while Mr Abbas was billed, they never received payment.

How many times do we go and check our statements for Medicare particularly. Maybe with credit cards, bank details but not with Medicare. These people are just looting the money.

Victim of Medicare fraud Tahir Abbas


The owner told the ABC the system would not allow them to receive bulk billing payments for more than one check-up in a two-year period.

Mr Abbas said he believed his card had been misused by others for their own benefit.

“I was very disgusted to be honest,” he said.

“It’s all bulk-billed and they are charging the Government. But in a way the Government is charging us so we are paying from our pocket – it’s all taxpayers’ money.”

He has urged people to check their Medicare statements.

“How many times do we go and check our statements for Medicare particularly. Maybe with credit cards, bank details but not with Medicare.

“These people are just looting the money.”

Medicare has told Mr Abbas they are investigating.

High-tech Medicare cards needed?

Technology and crime analyst Nigel Phair from the University of Canberra says the Medicare card is an easy to clone, low-tech card that has been around for three decades.

While it is low in value for identity check points, it is a well-respected document.


“The Medicare card carries no technology which gives it additional factors for verification or identification of users,” he said.

“It’s just a mag stripe on the back, very similar to a credit card from the 1990s without any chip or pin technologies, which are well known to be the way of the future.”

He says Medicare is vulnerable to abuse because people’s data is stored in many places such as doctors’ surgeries and pharmacies.

“It’s very easy to sail under the radar if you’re a fraudulent user. And like all good frauds you keep the value of the transactions low but your volume high,” he said.

“Because all we do have is anecdotal evidence and no hard statistics, we really don’t know how bad this issue is.”

Ms Payne does not support upgrading the quality of Medicare cards.

“The advice I have is that that is not really a large source of fraud and inappropriate practices,” she said.

Do you know more? Email investigations@abc.net.au


Topics: fraud-and-corporate-crimehealthhealth-administrationhealth-policygovernment-and-politicsfederal-government,law-crime-and-justiceaustralia

First posted Thu 6 Mar 2014, 12:00pm AEDT