Category Archives: facts & data points

sugar = heart disease

  • n=43,000 adults published in JAMA Int Med
  • a significant relationship between added sugar consumption and increased risk for CVD [cardiovascular disease] mortality”
  • 10%-25% of calories from added sugars had a 30% higher risk of heart disease vs less than 10% group
  • consuming more than 25% of calories from sugar (10% of the sample) were nearly 3 times as likely to die as a result of heart disease
  • In this latest study, sugar-sweetened beverages provided the largest amount of added sugar in participants’ diets, at 37.1%, followed by grain-based desserts at 13.7%, juice drinks (8.9%), dairy desserts (6.1%) and confectionery (5.8%).
  • “the present study, perhaps more strongly than previous ones, suggests that those whose diet is high in added sugars may also have an increased risk of heart attack.”
  • “The first target, now taken up by an increasing number of countries, is to tax sugar rich drinks. Whilst this may seem a blunt instrument, the food and drink industry are able to make positive changes in their food formulations and still remain very profitable. Ultimately, there needs to be a refocus to develop foods which not only limit saturated fat intake but simultaneously limit refined sugar content.”


http://www.foodnavigator-usa.com/R-D/Sugar-consumption-linked-to-heart-disease-death-risk/

Sugar consumption linked to heart disease death risk

The risk of dying from heart disease increased exponentially with the amount of added sugars consumed

The risk of dying from heart disease increased exponentially with the amount of added sugars consumed

Excessive consumption of added sugars in drinks, snacks and sweets is associated with an increased risk of dying from heart disease, according to a major US review published in JAMA Internal Medicine.

The review, which looked at the sugar consumption habits of nearly 43,000 adult participants in a national health survey, found a significant relationship between added sugar consumption and increased risk for CVD [cardiovascular disease] mortality”.

Dr Quanhe Yang of the Centers for Disease Control and Prevention in Atlanta and colleagues found that regularly consuming as little as one sugary fizzy drink a day was associated with an increased risk of death from heart disease. The results suggested that CVD mortality risk increased exponentially the greater the amount of sugar consumed on a regular basis.

“Our results support current recommendations to limit the intake of calories from added sugars,” they wrote.

This is not the first time that high sugar consumption has been linked to heart disease risk, but the researchers said that few studies had examined sugar consumption in connection with heart disease mortality.

WHO recommendations

The World Health Organisation recommends that fewer than 10% of a person’s daily calories should come from added sugars, but most people in Europe and the United States exceed that amount.

In this study, those who consumed 10% to 25% of calories from added sugars had a 30% higher risk of dying from heart disease compared to those whose sugar calorie consumption was less than 10% of total calories. Those for whom added sugars accounted for more than a quarter of calories – about 10% of the study sample – were nearly three times as likely to die as a result of heart disease.

A total of 71.4% of participants consumed more than 10% of their calories from added sugars.

Association…not causation

Commenting on the study, professor of metabolic medicine at the BHF Glasgow Cardiovascular Research Centre, Professor Naveed Sattar, said that observational studies can never prove that sugar consumption causes heart attacks.

“However, to ignore the mounting evidence for the adverse health effects of excess sugar intake would seem unwise,” he said. “Helping individuals cut not only their excessive fat intake, but also refined sugar intake, could have major health benefits including lessening obesity and heart attacks.”

“…We have known for years about the dangers of excess saturated fat intake, an observation which led the food industry to replace unhealthy fats with presumed ‘healthier’ sugars in many food products. However, the present study, perhaps more strongly than previous ones, suggests that those whose diet is high in added sugars may also have an increased risk of heart attack.”

In this latest study, sugar-sweetened beverages provided the largest amount of added sugar in participants’ diets, at 37.1%, followed by grain-based desserts at 13.7%, juice drinks (8.9%), dairy desserts (6.1%) and confectionery (5.8%).

Sattar added: “The first target, now taken up by an increasing number of countries, is to tax sugar rich drinks. Whilst this may seem a blunt instrument, the food and drink industry are able to make positive changes in their food formulations and still remain very profitable. Ultimately, there needs to be a refocus to develop foods which not only limit saturated fat intake but simultaneously limit refined sugar content.”


Source: JAMA Internal Medicine

Published online ahead of print. doi:10.1001/jamainternmed.2013.13563

“Added Sugar Intake and Cardiovascular Diseases Mortality among US Adults”

Authors: Quanhe Yang; Zefeng Zhang; Edward W. Gregg; W. Dana Flanders; Robert Merritt; Frank B. Hu.

Wearables meets big data

Some see this as an opportunity to mobilise a peer-to-peer health knowledge commons outside the healthcare system that is filtered through government, hospitals and GPs’ surgeries. This new healthcare system would exist out among the public.

Pioneered by Tedmed’s clinical editor, Wellthcare tries to pinpoint the new kind of value that this people-powered healthcare system would create.

“Wellth” is closer to the idea of wellbeing or wellness than health; it is about supporting “what people want to do, supported by their nano-networks”.

A healthcare system that uses data we collect about ourselves would require these new bodies to make much bigger choices about how NHS trusts procure products and services.

Going back to the ever expanding market for wearable technology – with a potential patient group of 80m, there should be a lot more going on to turn our physiological data in the treasure trove it could be. Forget supermarket reward points and website hits, the really big data only just arrived.


http://www.theguardian.com/science/political-science/2014/jan/27/science-policy

Big data gets physical

Posted by 
Tuesday 28 January 2014 01.05 EST
Can we make the rise of wearable technology a story about better health for everyone, not just better gadgets for me?
Smartphone app visualises two similar running routesSmartphone app visualises two similar running routesI am obsessed with my running app. Last week obsession became frustration verging on throw-the-phone-on-the-floor anger. Wednesday’s lunchtime 5km run was pretty good, almost back up to pre-Christmas pace. On Friday, I thought I had smashed it. The first 2km were very close to my perennial 5 min/km barrier. And I was pretty sure I had kept up the pace. But the app disagreed.As I ate my 347 calorie salad – simultaneously musing on how French dressing could make up 144 of them – I switched furiously between the two running route analyses. This was just preposterous; the GPS signal must have been confused; I must have been held up overtaking that tourist group for longer than I realised; or perhaps the app is just useless and all previous improvements in pace were bogus.My desire to count stuff is easy to poke fun at. It’s probably pretty unhealthy too. But it’s only going to be encouraged over the next few years. Wearable technology is here to stay. Smart phone cameras are also heart rate monitors. Contact lenses can measures blood sugar. And teddy bears take your temperature. A 2011 market assessment, estimated that there will be 80m sports, fitness and “wellness” wearable devices by 2016.

At the moment, it’s difficult to retrieve the data these systems collect. Nike only allow software developers access to data produced by people like me so they can create new features for their apps. I cannot go back and interrogate my own data.

Harbouring user data for product development is an extension of part of the search engine or mobile provider business model. When you log in to Gmail while browsing the internet, you give Google data about your individual search behaviour in exchange for more personalised results. Less obviously, when you use the browser on your phone, mobile companies collect (and sell) valuable data about what you are looking for and where you are. The latest iteration of this model is Weve, providing access to data about EE, O2 and Vodafone customers in the UK.

After Friday lunchtime’s outburst, I accepted that I’d never find the cause of my wayward run and quickly got absorbed back into the working day.

But I shouldn’t have.

We talk about the economic and social value of opening up government data about crime numbers or hospital waiting times. But what about the data we’re collecting about our daily lives? This is not just a resource for running geeks to obsess over, it provides otherwise unrecorded details of our daily lives. Sharing data about health has the potential to be an act of generosity and contribution to the public good.

For some areas of healthcare, particularly for type 2 diabetics or those with complex cardiovascular conditions, lifestyle information could make a huge difference to how we understand and treat patients. It could provide the kind of evidence badly needed to make headway in areas where clinical trials aren’t enough.

But it’s not yet easy to make something of this broader value created by fitness apps or soft toys with sensors in them. One person’s data is saved in different ways through different services – making for a messy, distributed dataset.

There is also no clear way to incorporate this into the current healthcare system. Some companies have made strides in that direction. Proteus Digital Health offers a system for monitoring a patient’s medication and physical activity using an iPad app and ingestible pills. This takes some much needed steps towards understanding how people comply with their prescription. At the moment, only 50% of patients suffering from chronic diseases follow their recommended treatment. If Proteus starts to sell information back to the health service, it will take digital health into mainstream healthcare. However,it hasn’t reached that point yet. And it is still a rare example of a company with the regulatory approval to do so. For example, Neurosky’s portable EEG machines, which measure brain activity, make excellent toys. But the company has no intention of certifying its products as medical equipment, given the time and expense it requires.

But does that matter? Neurosky’s wizard-training game Focus Pocus improves a player’s cognitive abilities including memory recall, impulse control, and the ability to concentrate. Some US medical practitioners are now prescribing Focus Pocus. This makes biofeedback therapy to ADHD patients available at home, replacing two to three hospital visits a week. This is going on anyway – outside the mainstream healthcare system.

Some see this as an opportunity to mobilise a peer-to-peer health knowledge commons outside the healthcare system that is filtered through government, hospitals and GPs’ surgeries. This new healthcare system would exist out among the public. Pioneered by Tedmed’s clinical editor, Wellthcare tries to pinpoint the new kind of value that this people-powered healthcare system would create. “Wellth” is closer to the idea of wellbeing or wellness than health; it is about supporting “what people want to do, supported by their nano-networks”. There is the potential for a future where we move from producers of data that is sucked up by companies into producers of data who consciously share it with one another, learn to interpret it and make judgments from it ourselves.

The current healthcare system may evolve to support this kind of change. In the UK, Academic Health Science Networks and Clinical Commissioning Groups provide new structures within the NHS that have the potential to support disruptive innovations. But so far these have led to small, incremental changes. A healthcare system that uses data we collect about ourselves would require these new bodies to make much bigger choices about how NHS trusts procure products and services.

Going back to the ever expanding market for wearable technology – with a potential patient group of 80m, there should be a lot more going on to turn our physiological data in the treasure trove it could be. Forget supermarket reward points and website hits, the really big data only just arrived.

Menadue on Medicare on its 40th anniversary

A terrific insider account of the extremely organic conception and birthing of Medicare (nee Medibank)….

John Menadue – 30th anniversary of Medicare

John Menadue. 30th anniversary of Medicare

Feb 1 is the 30th anniversary of Medicare. But the story of Medicare really goes back 40 years to the passing of the Medibank legislation by the Whitlam Government in a joint session of the Parliament on 7 August, 1974. 

Medibank started on schedule on 1 July 1975 when health insurance cards were issued to the Australian population.  

But the Fraser Government attempted to wind back Whitlam’s Medibank. The Fraser Government introduced legislation for Medibank Mark 2 that included a 2.5% levy and gave the public an option of taking out private insurance instead of paying the levy. It established Medibank Pte.

On 1 Feb 1984, the Hawke Government re-established the basic design of Whitlam’s Medibank. There were financial changes and the name changed from Medibank to Medicare which we have today. 

Medibank/Medicare was always a public insurance scheme. It has never delivered health services. It financed the existing health ‘system’. Unfortunately in the days since the establishment of Medibank/Medicare the health “system” has not been seriously reformed to reflect the experience and the needs of today. The vested interests in the health system that tried so desperately to derail Medibank/Medicare over a long period are still in play today, holding back essential reform. 

I wrote the article which is reproduced below in July 2000. It was published in the Medical Journal of Australia. It sets out the long and difficult struggle to launch Medicare.


Down a different path in Melbourne: how Medibank was conceived (John Menadue)

On a bleak midwinter night, the germ of an idea crystallised into a grand plan.

It was hard-going developing policies in Opposition, particularly for a reform party out of power during the long Menzies ascendancy. The task was made harder in Australia, with our written Constitution interpreted for many years by a conservative High Court.

A historic meeting

Health policy was no exception, but a turning point came on the night of 6 June 1967, at the home of Dr Moss Cass in Melbourne. Cass was among the most farsighted and perceptive thinkers on health policy that I have met. Cass was then in charge of a trade union health clinic in Melbourne and later became a Minister, but not Health Minister, in the Whitlam governments.

As Gough Whitlam’s Chief of Staff in an office of only three people in the mid-1960s, I had been building up groups of people who could advise him on a range of issues, such as education, science, housing, transport and health. These groups were the building blocks that Whitlam used to rewrite almost the whole of the ALP (Australian Labor Party) platform. That work came to fruition in the ALP’s election victory of 1972. The groups were made up of professionals, academics and other reform-minded people who freely gave their skill and time. Few were members of the ALP.

Professor Sol Encel was my chief collaborator in building these groups. He was Reader in Political Science at the Australian National University at the time and later became Professor of Sociology at the University of New South Wales. Encel suggested Cass as an adviser on health policy. Cass had written an influential Fabian Society pamphlet on health policy and advocated a national health system founded on public hospitals and health centres staffed by salaried doctors.

In 1967, the ALP’s election prospects seemed as bleak as the midwinter night when Whitlam and I rang Cass’s front door bell. Many years later, Whitlam asked me what time of the year the meeting was held. I recalled it was midwinter because Cass had lit a log fire to try to cheer us up. The evening turned out to be a historic turning point, although no-one recognised it at the time.  If we had realised how important it was, we would at least have had a photographer present!

Cass had also invited Dr Rod Andrew, Foundation Dean, Faculty of Medicine at Monash University, who had been a public advocate of more salaried staff in hospitals. Also pre­sent was Dr Jim Lawson, Superintendent of the Footscray Hospital, who was described by Cass as having a view that there were too many hospital beds, and that they should be used more efficiently and with greater emphasis on care in the community. Dr Harry Jenkins, the ALP spokesman on health in the Victorian State Parliament, was also present. However, the key attendees. were two young researchers from the Institute of Applied Economic Research at Melbourne University, John Deeble and Dick Scotton. Deeble had previously been Deputy General Manager of the Peter MacCallum Clinic in Melbourne.  Scotton had   been economist at the Commercial Banking Company in Sydney and doing ground-breaking research at Melbourne University on the pharmaceutical industry, hospital costs and compulsory and voluntary health insurance.

A scheme of universal health insurance

From that 6 June 1967 meeting, Deeble and Scotton developed a universal and compulsory health insurance scheme to be funded by a tax levy. It was clear that the Liberal-Country Party Coalition Government’s voluntary health insurance scheme, supported by taxpayers’ funds, was wasteful and inequitable and that an alternative was needed.

In May 1968, Deeble and Scotton distributed their paper, A scheme of universal insurance (unpublished paper, Institute of Applied Economic Research, May 1968). Whitlam used this academic treatise as a major input in his own policy development. In July that year, 13 months after the meeting at Cass’s house and almost five years before he became Prime Minister, Whitlam outlined The alternative national health program (called “Medibank”, and later “Medicare”), which was  to become so much part of Australian national life. The Deeble and Scotton ideas became a practical and political program. Once again, rigorous policy development and a compelling Whitlam speech became party policy.

In retrospect, the June 1967 meeting took health down a path that neither Whitlam nor I expected. We were looking in another direction. Medibank was about financing access to “the health system”, not about how the health system could better deliver services to the community. It is noteworthy that, 25 years after the obvious success of Medibank, with increased demands on the health system in a consumer society, we are being forced to again consider how we can better deliver health services. Access to “the health system” is no longer sufficient; the system itself needs attention.

In most of the seven years I spent with Whitlam, we were not working on a compulsory health insurance scheme, but focusing on how to develop and strengthen a public hospital system with regional clinics and services. Because of the constitutional and political barriers to nationalisation of the medical profession, the only feasible route seemed to be via increased Federal Government funding for expanded State public hospital systems that could compete with private hospitals and private doctors.

The overseas experience

Many of us in the ALP at the time were attracted to the National Health Service (NHS) which the British Labour Party had introduced in the 1940s. But such a scheme in Australia was constitutionally impossible. It was also politically hazardous, with doctors in many countries suspicious of and rigorously opposed to the British NHS at the time, although it has stood the test of time much better than its many critics.

With Cass’s assistance, we read the literature on different healthcare schemes around the world.  What  caught  our attention were the many surveys and analyses which showed that fee-driven, private medicine resulted in excessive treatment, high costs and orientation away from preventive care. These health schemes were overwhelmingly producer- rather than consumer-driven and were inherently unstable, with suppliers of the services substantially managing the demand. I recall particularly articles in the New England Journal of Medicine about the development of health maintenance organisations in the United States in response to escalating private health costs.

A national hospital system

In 1961, long before Deeble and Scotton came along and Medibank was conceived, Whitlam had described his path for health reform in his Curtin Lecture: “…the best way to achieve a proper national health service is to establish a national hospital system.” He added:

“…the proper approach is for the Commonwealth to make additional grants to the States on condition that they regionalise their hospital services and establish salaried and sessional medical and ancillary staff in hospitals.”

These ideas were further developed and articulated in a speech which he gave to the citizens of Rochester, Victoria, in 1964. They were clearly nonplussed when, at their rural hospital, he told them that “it is more important to nationalise hospitals than to nationalise the medical profession”. What was he talking about? This was Whitlam’s way of circumventing the constitutional obstacles, although it seemed very remote from the problems facing Rochester. While Federal Parliament could “make laws with respect to … pharmaceuticals, sickness and hospital benefits”, it could not “authorise any form of civil conscription”. Nationalisation of the medical profession, as in the United Kingdom, was out, but a national health service based on “Section 96″ federal grants to the States for hospitals with regional health services and employing salaried staff was seen as a way forward. There would be choice for doctors and patients. (Under Section 96 of the Australian Constitution, “the [Commonwealth] Parliament may grant financial assistance to any State on such terms and conditions as the Parliament thinks fit”.)

Elected in 1972, the Whitlam Government introduced a five-year program of capital assistance for hospitals. Under Section 96 of the Constitution, these were “special purpose grants”. The Fraser* Coalition Government did not renew the program, nor did the Labor governments of Hawke or Keating.

However, after June 1967, major health reform was to go down the Medibank compulsory insurance route rather than the funding of hospitals and related services. Medibank would prove simpler to explain and implement. It was also a more likely political winner.

Voluntary versus compulsory health insurance

While developing reforms based on hospitals, Whitlam had been persistently criticising the shortcomings of voluntary health insurance. He had asked many questions on notice in Federal Parliament since the early 1960s about the high cost, high reserves and limited coverage of private health funds. We were of the view that, on a per capita basis, the total cost of the Australian health system exceeded by a large margin the cost of the NHS in the United Kingdom, but we were finding it hard to prove. We could identify the Government’s health costs, but the additional costs to individuals, either directly or through their health funds, were hard to pin down. We suspected that the higher costs in Australia were due to the inefficiencies of the health funds and the perverse financial incentives inherent in fee-for-service, which encouraged over servicing and overprescribing.

So when Whitlam met Deeble and Scotton to discuss their new approach to health insurance, he was very receptive, although I recall that the 6 June meeting was slow to begin, with Whitlam’s eyelids drooping a few times. But his interest sparked up dramatically when Deeble and Scotton explained that in their view a compulsory and universal scheme would be cheaper than existing arrangements. There· was thus the exciting prospect ahead of a health scheme that was both universal and also politically defensible as to its cost.

Whitlam’s critique of voluntary health insurance, supported by the work of Deeble and Scotton, was confirmed by Justice Nimmo in his 1969 report. (The Coalition Government had established the Nimmo inquiry into health insurance to try to pre-empt the findings of a Senate committee which was reviewing health insurance.)

The campaign against Medibank

The long drawn out battle for the Medibank reforms was unrelenting in both the 1969 and the 1972 elections. John Cade, General Manager of the Medical Benefits Funds of Australia, said in August 1968, one month after Whitlam outlined his “Alternative National Health Program”, that “Karl Marx’s theories have never been wanted by Australians in the past and they are needed even less today …If you want to pervert the truth and have it believed, tell a whopper and tell it often!”

It wasn’t a particularly well argued or dispassionate analysis of Whitlam’s proposals, but Cade’s comments give some idea of the hype and passion of the anti-Medibank campaign. Health funds spent contributors’ money, including mine, to fight Medibank.

The Australian Medical Association (AMA) and the more militant General Practitioners’ Society in Australia conducted a shrill and long campaign against Medibank. An AMA “freedom fund” was established. Television, radio and newspaper advertising, supported by a public relations campaign, was waged relentlessly, year after year. The AMA sent letters and publicity kits to all doctors. They were designed to keep up the “noise level”. Even a former Miss Australia was called to the battlefront following petitions in Federal Parliament and “calls to action” by doctors. Without any apparent sense of irony, the campaign against Medibank was described by the AMA as protecting the “doctor and patient relationship”.

The two Medibank Bills were three times rejected by the Senate after the 1972 election and were only finally passed after a double dissolution of Federal Parliament and the joint sitting of Parliament in July 1974. The Medibank Bills were two of the six Bills on which a double dissolution had been secured in April 1974. But, even then, the Coalition Opposition, supported by doctors, would not concede. The implementation of Medibank was delayed further by the Senate in late 1974 when it rejected three Bills to impose a 1.35% levy on taxable incomes. As a result it was decided to finance the scheme initially from general revenue, and the funding was provided in Bill Hayden’s first Budget in August 1975. At that time I was Secretary of the Department of Prime Minister and Cabinet.

The future

It had been a long and bitter campaign from that midwinter night in Melbourne in 1967 to spring in Canberra in 1975. No government will now seriously tamper with the compulsory and universal health insurance scheme. The area of concern and debate for the future will not be so much about funding of Medicare, but rather about how we improve the delivery of health services.

Flu Predictor

Pretty cool… lots of good imagery for a presentation.

One day, it’ll find itself on the weather report.

Put another way, the weather report is one of the most popular, early uses of big data available in the community.


http://www.fastcoexist.com/3025365/find-out-when-youll-be-sick-with-the-first-online-flu-predictor

Find Out When You’ll Be Sick With The First Online Flu Predictor

Want to know when exactly to start avoiding everyone around you who so much as sneezes? This online tool can tell you when the flu will strike in your city–more than two months in advance.

I should have seen it coming. First it felled my boyfriend’s roommates, then my boyfriend, and then my roommate. Then, two weeks into the viral sensation sweeping the nation, I fell asleep with a sore throat, and woke up with a head full of mucus.

Luckily, it wasn’t the flu. But if it was, last week was also the first time I could have predicted when such a flu might strike my part of town, as it does during the peak flu months between October and April. That’s because, earlier this month, scientists at Columbia University’s Mailman School of Public Health uploaded a first-of-its-kind flu prediction model online.

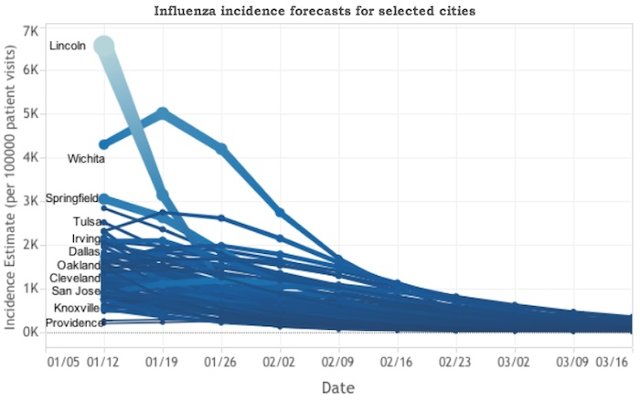
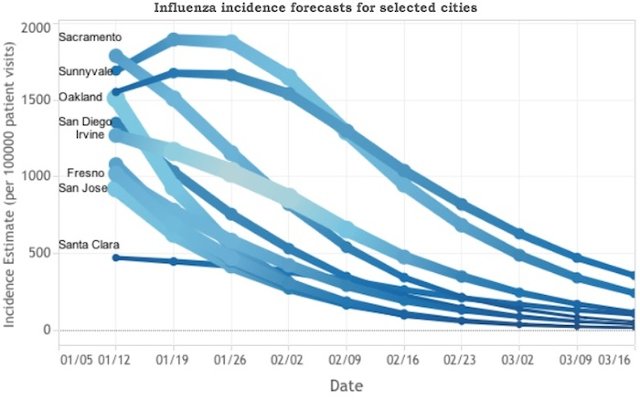
In December, assistant professor of environmental health sciences Jeffrey Shaman told Co.Exist about the tool he and his colleagues had developed to predict the flu up to nine weeks in advance. Using data from Google Flu Trends and weekly CDC infection rates, the Columbia model was able to predict the exact timing of flu arrival accurately in 63% of the American cities it analyzed.

One day, Shaman suggested, the predictions might become so accurate that they’re eventually broadcast next to the weather on TV.

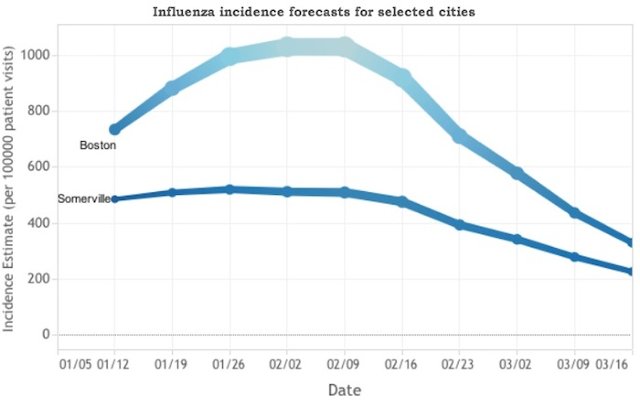
In the meantime, that model now exists on the good ‘ole Internet. It predicts some relief for Lincoln, Nebraska, which appears to be coming down from quite an illness, as does Wichita. Boston, on the other hand, looks like it’ll be experiencing an increase in flu cases over the next couple of weeks, as will New York City.

On the map above the predictor, you can check out CDC data for flu patient visits to the doctor’s office from the week prior. Next to the predictor, click on your state in the tree map to find out which cities will be most afflicted.

[Image: Blowing nose via Flickr user Anna Gutermuth]

Ornish at TED

http://deanornish.com/

  • Wellness vs Illness – We vs I
  • 95% of NCD is preventable
  • NCDs are also reversible
  • Prostate Cancer, Breast Cancer susceptible to diet change
  • Obesity Trends in the US – new categories on the US map
  • Has worked with McDonalds and Pepsi to advise on products – didn’t go anywhere

Ornish Healthways Spectrum Program
http://deanornish.com/ornish-spectrum/

16 min: Healing Through Diet
http://www.ted.com/talks/dean_ornish_on_healing.html

3 min: Your Genes Are Not Your Fate

3 min: Killer Diet

Flexitarians – 9% meat consumption reduction 1990-2009

  • meat consumption in the developed world is reducing
  • FAOSTAT indicates that in Western Europe, Europeans ate 87kg of meat per capita in 2009 vs 95.5kg in 1990
  • This is meat reduction, not increased vegetarianism
  • Vegetarianism is reported at 9-10% in Italy and Germany
  • Three quarters of Dutch consumers say they have at least one meat free day per week; 40% say they eat no meat at least three days per week
  • Flexitarianism is not cool – low identification factor
  • contributing factors include: rising meat prices; poor economic conditions; environmental concerns; animal welfare; health concerns
  • Some interesting trends in developing countries with rising incomes

“Given the enormous environmental impact of animal-protein consumption and the apparent sympathy of consumers for meat reduction, it is surprising that politicians and policy makers demonstrate little, if any, interest in strategies to reduce meat consumption and to encourage more sustainable eating practices.”

 “It is expected that increases in meat consumption will taper as incomes rise, a pattern that is already evident for China, as shown by the almost straight line of rising meat consumption against logarithmic increases in income. For Brazil, however, it seems that the tapering is less pronounced,”

http://www.foodnavigator.com/Financial-Industry/Plant-based-diets-The-rise-and-rise-of-flexitarian-eating

Plant-based diets: The rise and rise of flexitarian eating

Meat reduction – or ‘flexitarian’ eating – is on the rise. In this special edition article, FoodNavigator asks why are consumers reducing meat, and how prevalent is the trend?

Food Vision

In large parts of the developing world, meat consumption is increasing, but in some developed nations – including in parts of Europe – it is declining. According to FAOSTAT figures, Western Europeans ate about 87 kg of meat per capita in 2009 compared to 95.5 kg in 1990 – a drop of 9% in less than 20 years.

This reflects a trend of meat reduction, rather than of rising vegetarianism, although the proportion of Europeans who identify as vegetarian has increased too, with rates varying from about 1-2% in some countries, to about 9-10% in Italy and Germany.

Meanwhile, a new dietary pattern has cropped up. Dubbed flexitarianism, it refers to meat reduction rather than fully fledged vegetarianism.

Growing trend – but it’s not cool

Germany and the Netherlands lead the way in this ‘flexitarian’ way of eating. Research from Wageningen UR last year revealed that more than three-quarters of Dutch consumers say they have at least one meat-free day per week – and 40% eat no meat at least three days a week.

“Reducing meat consumption is a growing trend, but the majority of people keep to their current pattern of meat consumption,” say the researchers, led by Hans Dagevos from the university’s Agricultural Economics Research Institute, adding that only 13% of consumers described themselves as flexitarians.

“Reducing meat consumption is not seen as ‘cool’. There is a low identification factor.”

But even if there is little acceptance of the term ‘flexitarian’, what is behind this shift in eating patterns?

Meat-free movements

There are several key reasons: In the past few years, rising meat prices have coincided with a struggling economy, meaning that many western consumers have cut consumption on the back of shrinking incomes; shoppers are becoming more aware of the environmental impacts of eating meat; animal welfare issues have also gained attention; and consumers have started to question how healthy it is to eat large quantities of meat.

Meat reduction has also been boosted by regional meat-free movements, generally coordinated by NGOs, including vegetarian, animal protection and environmental organisations.

In another recent paper on sustainability issues and meat reduction , Dagevos wrote: “Given the enormous environmental impact of animal-protein consumption and the apparent sympathy of consumers for meat reduction, it is surprising that politicians and policy makers demonstrate little, if any, interest in strategies to reduce meat consumption and to encourage more sustainable eating practices.”

According to his analysis, flexitarians tend to value non-meat protein sources more highly than their heavy-meat eating counterparts. These include cheese, eggs, nuts, mushrooms and pulses, alongside meat sources such as chicken and fish.

Rising meat consumption elsewhere

Meanwhile, meat consumption continues to rise in developing countries – but could those in developing countries be convinced to adopt a similar way of ‘flexitarian’ eating, even as rising incomes allow them to choose more meat products for the first time?

recent paper from the Overseas Development Institute (ODI ) pointed out that meat consumption does not rise endlessly in tandem with income, and this pattern is expected even in emerging markets – although it depends on the nation’s food culture.

“It is expected that increases in meat consumption will taper as incomes rise, a pattern that is already evident for China, as shown by the almost straight line of rising meat consumption against logarithmic increases in income. For Brazil, however, it seems that the tapering is less pronounced,” it said.

National Obesity Forum exaggerates crisis

Meh, but shows its important to be above reproach in public discussions…

http://www.foodnavigator.com/Legislation/We-exaggerated-obesity-crisis-pressure-group/

‘We exaggerated obesity crisis’: pressure group

Post a comment

By Mike Stones+

20-Jan-2014

The National Obesity Forum has admitted exaggerating Britain's obesity crisis

The National Obesity Forum has admitted exaggerating Britain’s obesity crisis

Influential lobby group the National Obesity Forum (NOF) has admitted exaggerating the severity of the UK’s national obesity crisis and relying on anecdotal evidence, rather than scientific research, in its State of the Nation’s Waistline report published last week.

Food Vision

The document – which received widespread media coverage – claimed predictions made in the 2007 Foresight Report that half of Britons could be obese by 2050 had under-estimated the crisis. In reality, the problem was growing worse, it claimed.

But NOF spokesman Tam Fry told BBC Radio 4’s statistics programme More or Less, that the group had exaggerated its warnings about the scale of the obesity crisis in order to reach a wider public.

“What we were trying to do is force home[its obesity warning] …”, he said. “A little exaggeration forces the message home – that’s what we wanted to do.”

‘A little exaggeration’

Fry also acknowledged the NOF should have made clear its report was based on anecdotal rather than scientific research. “I think maybe we were a little wrong not to be more forceful about why we were drawing these conclusions,” he told the programme.

“We think it [the obesity problem] has got worse, because although we have no statistics and figures, we have a lot of observations,”said Fry. “The word coming through from clinics all over the country is the greater volume of people coming in for obesity – but, more importantly, coming in for the conditions that it engenders.” That included diabetes, cardio-vascular problems and strokes.

Since the Foresight report was completed, there had been little improvement in government action to remedy the problem of obesity, leading the NOF to conclude that the problem is growing still, said Fry.

‘Not as bad as we thought’

The programme highlighted research conducted after the 2007 study that suggested Britain’s obesity crisis was not becoming worse. Ben Carter, the programme’s obesity expert, said:“Most of the data published since 2007 has shown that things are not as bad as we thought – or at least not deteriorating at the rate we thought we would.”

US research was also quoted suggesting while the obesity problem was a serious problem, it was not becoming ever worse.

But Fry claimed there were various problems with the data. Chief among those was its reliance on body mass index, which generally under reports overweight and obesity. “There is a lot of literature that states that for a fact,” he said.

Speaking after the programme Fry told FoodManufacture.co.uk the Department of Health “had all the time in the world to say that the report was rubbish but they didn’t”.

Fry added: “Obesity is such a problem that that doctors now say 2M need gastric bands to curb their food intake. Also, gout, which used to be the preserve of kings, is now a lot more common .”

Listen to More or Less here .

Institute for Health Metrics and Evaluation (IHME)

Gates Foundation backed Washington University team doing some amazing work on gathering, analysing and presenting global burden of disease metrics for easy browsing.

http://www.healthmetricsandevaluation.org/gbd/visualizations/gbd-arrow-diagram

Data Visualizations

IHME strives to make its data freely and easily accessible and to provide innovative ways to visualize complex topics. Our data visualizations allow you to see patterns and follow trends that are not readily apparent in the numbers themselves. Here you can watch how trends in mortality change over time, choose countries to compare progress in a variety of health areas, or see how countries compare against each other on a global map.

Not sure which visualization will provide you with the results you are looking for? Click here for a guide that will help you determine which tool will best address your data needs.

GBD Compare is new to IHME’s lineup of visualizations and has countless options for exploring health data. To help you navigate this new tool, we have a video tutorial that will orient you to its controls and show you how to interact with the data. You can also watch the video of IHME Director Christopher Murray presenting the tools for the first time at the public launch on March 5, 2013.

Tobacco Burden Visualization

This interactive data visualization tool shows modeled trends in tobacco use and estimated cigarette consumption worldwide and by country for the years 1980 to 2012. Data were derived from nationally representative sources that measured tobacco use and reports on manufactured and nonmanufactured tobacco.

US Health Map

With this interactive map, you can explore health trends in the United States at the county level for both sexes in: life expectancy between 1985 and 2010, hypertension in 2001 and 2009, obesity from 2001 to 2011, and physical activity from 2001 to 2011.

GBD Compare

Analyze the world’s health levels and trends in one interactive tool. Use treemaps, maps, and other charts to compare causes within a country, compare countries with regions or the world, and explore patterns and trends by country, age, and gender. Drill from a global view into specific details. Watch how disease patterns have changed over time. See which causes of death and disability are having more impact and which are waning.

Mortality Visualization

How does input data become a GBD estimate? Walk through the estimation process for mortality trends for children and adults for 187 countries. See the source data and then watch as various stages in the estimation process reveal the final mortality estimates from 1970 to 1990.

COD Visualization

Where do we have the best data on the different health conditions? For any age group, see where the various data sources have placed the trends in causes of death over time. You can examine more than 200 causes in both adjusted and pre-adjusted numbers, rates, and percentages for 187 countries.

GBD Insight

What are the health challenges and successes in countries around the world?

GBD Heatmap

How do different health challenges rank across regions?

GBD Arrow Diagram

How has the burden of different diseases, injuries, and risk factors moved up or down over time?

GBD Uncertainty Visualization

Where do we have the best data on the different health conditions?

GBD Cause Patterns

What diseases and injuries cause the most death and disability globally?


Diabetes and the brain

  • Good summary on the state of understanding the strengthening relationship between glucose metabolism and dementia
  • Type 2 diabetes is a very strong risk factor for dementia – Alzheimer’s disease is sometimes referred to as “Type 3 diabetes”
  • It also results in brain atrophy
  • Metabolic syndrome is also implicated in dementia
  • High insulin in the body means lower insulin in the brain due to a reduction in BBB insulin receptors, and insulin helps clear toxic beta-amyloid from the brain
  • The key to lowering blood sugar and insulin is lose excess weight and exercise more
  • a diet high in high GI carbs and saturated fat is associated with higher unbound beta-amyloid fragments in their CSF. Subjects on lower GI carbs and low saturated fat had less

http://www.nutritionaction.com/daily/diabetes-and-diet-cat/the-effect-of-diabetes-on-the-brain/

The Effect of Diabetes on the Brain

Can high blood sugar lead to brain atrophy?

 • January 16, 2014
“Type 2 diabetes is a very strong risk factor for dementia,” says Jae Hee Kang, assistant professor of medicine at Harvard Medical School and the Brigham and Women’s Hospital in Boston. “Some people call Alzheimer’s disease type 3 diabetes.”

(In type 1 diabetes, blood sugar soars because the body makes no insulin, the hormone that acts like a key to allow sugar into cells. In the more common type 2 diabetes, blood sugar soars because insulin no longer works properly—that is, people are insulin resistant.)

Act now to download your FREE copy of Diabetes and Diet: Decoding Diabeteswithout cost or obligation.

“There’s no question that diabetes damages small blood vessels,” says David Knopman, professor of neurology at the Mayo Clinic in Minnesota.

It may also shrink parts of the brain. A recent study found more brain atrophy in 350 people with diabetes than in 363 people without the disease.

It’s not just those with diabetes who are at risk. People who have what doctors call “metabolic syndrome” also have a higher risk of cognitive decline. That’s roughly one out of three U.S. adults.

Their blood sugar levels are higher than normal, but not high enough to be diabetes. That gives them an increased risk of dementia.

And they may have high blood insulin levels because obesity—especially an oversized waist—has made them insulin resistant. (When insulin doesn’t work well, the pancreas responds by pumping out more.)

That may also spell trouble for the brain. Men with high blood insulin levels declined more on cognitive tests over three years than those with lower levels.

Why would high levels of insulin in the blood matter?

“High insulin in the body means lower insulin in the brain,” says Angela Hanson, a physician and senior fellow at the University of Washington School of Medicine.

That’s because, over time, high levels of insulin in the blood may shrink the number of receptors for insulin in the blood-brain barrier, allowing less to enter the brain, says Hanson. And insulin may help keep the brain healthy.

“Insulin helps clear toxic beta-amyloid out of the brain,” Hanson explains. “So if you put someone on a diet that increases brain insulin, you might have less of the toxic amyloid around.”

The key to lowering sugar and insulin in the blood—and presumably raising insulin in the brain—is to lose excess weight and exercise more.

But one pilot study suggests that it’s not just how much, but what you eat that matters.

Hanson and her colleagues assigned 20 older adults without mild cognitive impairment and 27 older adults with MCI to eat one of two diets. The LOW diet was low in saturated fat, and its carbs had a low glycemic index—that is, they didn’t cause a bump in blood sugar. The HIGH diet was high in saturated fat, and its carbs had a high glycemic index.

The HIGH diet was unusually high in saturated fat and sugar, but it wasn’t off the charts. “If you look at a fast-food combo meal, it’s got a sugary soda and a high-fat burger,” notes Hanson.

After four weeks, people who got the HIGH diet had higher levels of unbound beta-amyloid fragments in their cerebrospinal fluid (which bathes the brain and spinal cord), while people who ate the LOW diet had lower levels.

“The theory is that the beta-amyloid that’s not bound to fats or other lipids is free, and it’s free to wreak havoc, if you will,” says Hanson. “We believe it’s a more toxic form of beta-amyloid because it’s less likely to be cleared. But that’s hard to test in humans.”

The results seemed to fit with a finding from a similar, earlier study: the LOW diet raised insulin levels in cerebrospinal fluid (and presumably the brain), while the HIGH diet lowered insulin levels.

“A Western diet or obesity or other things that cause high blood insulin may decrease brain insulin,” says Hanson. “If you make someone less insulin resistant with weight loss or a diet, they may have more brain insulin.”

Until more studies are done, it’s too early to know if a diet lower in saturated fat and sugars can protect the brain. But the research is encouraging.

“The most striking finding from these studies was that you could change the brain chemistry of people who have mild cognitive impairment,” says Hanson.

“When I’m in my clinic, I can tell patients with MCI that if they eat a healthier diet and exercise, things might get better. That’s the message that keeps me going.”

Sources: J. Am. Geriatr. Soc. 56: 1028, 2008; Exp. Gerontol. 47: 858, 2012; Diab. Care 36: 4036, 2013; JAMA 292: 2237, 2004; N. Engl. J. Med. 369: 540, 2013; Eur. J. Pharmacol. 719: 170, 2013; Neuroepidemiol. 34: 200, 2010; JAMA Neurol. 70: 967, 972, 2013; Arch. Neurol. 68: 743, 2011.

Weight training reduces diabetes risk by 18%


http://www.medicalobserver.com.au/news/weight-training-cuts-type-2-diabetes-risk-in-women

Weight training cuts type 2 diabetes risk in women

Emily Dunn   all articles by this author

WOMEN who regularly lift weights or do other resistance exercise may reduce their risk of developing type 2 diabetes, a study has found.

Researchers from Harvard Medical School followed up 99,316 women aged 36–81 years who were participants in the Nurses’ Health Study and found that those who reported weekly sessions of just 30 minutes of total muscle-strengthening activity had an 18% lower relative risk of type 2 diabetes, compared to their non-weight lifting counterparts.

Total muscle strengthening activities included resistance training as well as lower-intensity exercise such as yoga or stretching.

Women who participated in resistance exercise had the lowest relative risk, but even those who only participated in the lower-intensity activity showed an improvement in relative risk compared to those who did nothing.

The benefits were on top of any benefits gained from aerobic exercise. The women who engaged in the recommended 150 minutes of aerobic activity and at least an hour of muscle-strengthening activity per week had the most substantial relative risk reduction, cutting their chance of developing type 2 diabetes by a third.

Previous research has shown the importance of aerobic activity to stave off type 2 diabetes, and regular resistance training is already recommended for both men and women to maintain muscle mass and protect against other diseases.

However, this is the first study to demonstrate the benefits of muscle-strengthening for the prevention of type 2 diabetes, and that the findings concur with similar research in men.

The results are also consistent with those published last year from the 2004–05 Australian Diabetes, Obesity and Lifestyle Study that found regular strength training was associated with lower prevalence of impaired glucose metabolism, independent of other physical activity.

PLOS Med 2014; online 14 January