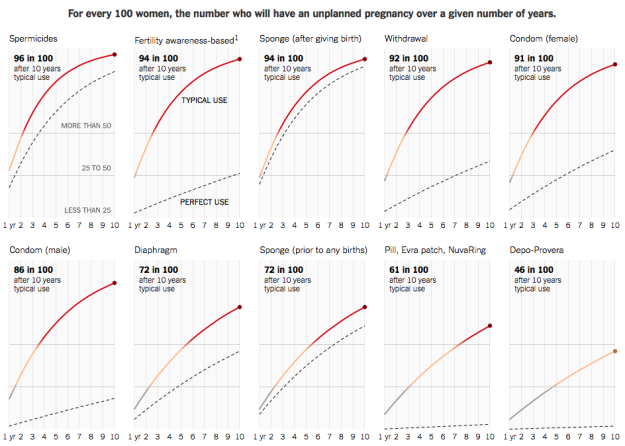
Probabilities of failing birth control methods

In high school health class, where I learned about contraceptives and the dangers of pre-marital sex, my teacher spouted rates to scare. He would say something like condoms are 98 percent effective but never explained what that meant. Do they break 2 percent of the time? Do couples get pregnant 2 percent of the time? STDs?
These charts from Gregor Aisch and Bill Marsh might help. They show the probability of an unplanned pregnancy, categorized by contraceptive and over a span of ten years. The top solid lines represent probabilities with “typical use” and the dashed lines on the bottom represent probabilities with “perfect use.”
Maybe it’s time for better instructions on how to use these things.
Update: The calculation of long-term probabilities is likely on the pessimistic side and makes too many assumptions about the data and population. Andrew Whitby critiques.